|
Size: 6774
Comment:
|
Size: 6759
Comment:
|
| Deletions are marked like this. | Additions are marked like this. |
| Line 181: | Line 181: |
| {{attachment:lesson2_GettingHeights.jpg||width=300}} | {{attachment:EM00041.jpg||width=300}} |
Fixing Landmarks
Image of thing to try:

When to Fix Landmarks
At the end of each tiling or iteration, a form of find_nofit (T or P) is used to check for bad landmarks.
A common find_nofit output will look soemthing like this:
EQ0004:   cat 004.OOT
EP0002:   cat 005.OOT
EP0003:   cat 006.OOT
EO0003:   cat 007.OOT
EN0003: * cat 008.OOT
EN0004: * cat 009.OOT
EM0003: . cat 010.OOT
EM0004: * cat 011.OOT
132 deleted
   !  cat 132.OOTThe
The Four main types of find_nofit outputs are:
- ! - the landmark was deleted
- . - the landmark has overlaps
- (space) - the landmark has minor error (don't worry about it).
- * - the landmark has a major error and must be fixed.
All errors are worth recording, but the only output from find_nofit that warrants serious concern is *. Whenever a * is present in the find_nofit output the landmark that * is associated with must be fixed. To fix bad land marks lithos is used in the working directory.
How to Fix Landmarks
Once a problem landmark is identified, the executable lithos can be entered in the working directory to fix the landmark. The steps to do this are as follows:
Step 1
The first major step in fixing a bad landmark is to select that landmark within lithos. As an example, the landmark EM0004 in the find_nofit output above has major errors. To select this landmark the following commands are entered in the lithos executable:
i
EM0004
n
n
The output of these commands looks like this:
Current landmark = NONE
Main Menu: Q 0123O IUCRSG NVAMBX DEPL FZH? i
 >i

 Input 6-character landmark name.[Q]
EM0004
    -0.31014     0.47683    -0.31113     0.29307

 gc slope.pgm


 Check for more images? y[n]
n
 Include a single image? y[n]
n
Step 2
With a landmark identified in lithos, the next step is to align the landmark within various images of which it is present to one another. To do this, the following commands are typed into the lithos main menu.
1
0
1
The output of these commands looks like this.
Main Menu: Q 0123O IUCRSG NVAMBX DEPL FZH? 1
 >1

 0. Auto align
 1. Individual shift
 2. Global shift
 3. Align with picture
 4. Align with gradient
 q. Quit
0
 0


    k     picnm            lambda      phi      cvg       nlmk

    1   M595328241F0        1.541     0.000     1.000     347
    2   M595414641F0        1.093     0.000     1.000     140
    3   M595415038F0        1.282     0.000     1.000     171
    4   M595415434F0        1.227     0.000     1.000     188
    5   M595415831F0        1.301     0.000     1.000     203
    6   M595416228F0        1.312     0.000     1.000     230
    7   S595062704F1        1.391     0.000     1.000     173
    8   S595063099F1        1.138     0.000     0.548     189
    9   S595063212F1        1.385     0.000     1.000     202
   10   S595063299F1        1.474     0.000     0.702      93
   11   S595063602F1        1.390     0.000     0.885     190
   12   S595063694F1        1.372     0.000     1.000     123
   13   S595063997F1        1.385     0.000     0.550     201
   14   S595281612F2        1.857     0.000     0.569      53
   15   S595282021F2        0.170     0.000     0.801     112

 gc LMRK_DISPLAY0.pgm
 gc LMRK_DISPLAY1.pgm

 check display

 enter spacing
1
 1
   1   M595328241F0       0.0000    0.0000     0.000
   2   M595414641F0       -0.014     0.116     0.825 ++++
   3   M595415038F0       -0.012     0.124     0.850 ++++
   4   M595415434F0       -0.044     0.061     0.827 ++++
   5   M595415831F0       -0.034    -0.109     0.790 ++++
   6   M595416228F0        0.231     0.101     0.698 +++
   7   S595062704F1       -0.027     0.018     0.685 +++
   8   S595063099F1       -0.027     0.017     0.821 ++++
   9   S595063212F1       -0.015    -0.005     0.778 ++++
  10   S595063299F1       -0.017    -0.005     0.854 ++++
  11   S595063602F1       -0.010     0.005     0.775 ++++
  12   S595063694F1       -0.013    -0.010     0.779 ++++
  13   S595063997F1       -0.017    -0.016     0.670 +++
  14   S595281612F2        0.075     0.159     0.608 +++
  15   S595282021F2       -0.011     0.000     0.684 +++
     0.068     0.069

 new spacing? y[n]
From the output above, the + marks next to each picture indicate how well its respected image is correlated with the others/topography. The more landmarks the better. The columns to the right of the image names indicate how much each image has moved in the x, y, and z direction (by pixels?)respectfully. For the the example, all the images seem to be well correlated except for the first image. This means that the first image needs to be moved more than 1 space (which was previously selected) to correlate. Thus the following commands are entered to see if the first image will become correlated.
1
3
These give the following output:
new spacing? y[n]
y

 enter spacing
3
 3
   1   M595328241F0        2.703     5.959     0.819 ++++
   2   M595414641F0       -0.266     0.064     0.877 +++++
   3   M595415038F0       -0.269     0.087     0.897 +++++
   4   M595415434F0       -0.185     0.116     0.869 +++++
   5   M595415831F0       -0.063     0.138     0.830 ++++
   6   M595416228F0        0.283     0.534     0.751 ++++
   7   S595062704F1        0.101    -0.178     0.795 ++++
   8   S595063099F1       -0.007    -0.115     0.891 +++++
   9   S595063212F1        0.044    -0.144     0.861 +++++
  10   S595063299F1        0.002    -0.103     0.899 +++++
  11   S595063602F1        0.057    -0.243     0.853 ++++
  12   S595063694F1       -0.007    -0.138     0.862 +++++
  13   S595063997F1        0.099    -0.437     0.778 ++++
  14   S595281612F2       0.0000    0.0000     0.000
  15   S595282021F2       -0.183     0.015     0.715 +++
     0.719     1.558

 new spacing? y[n]
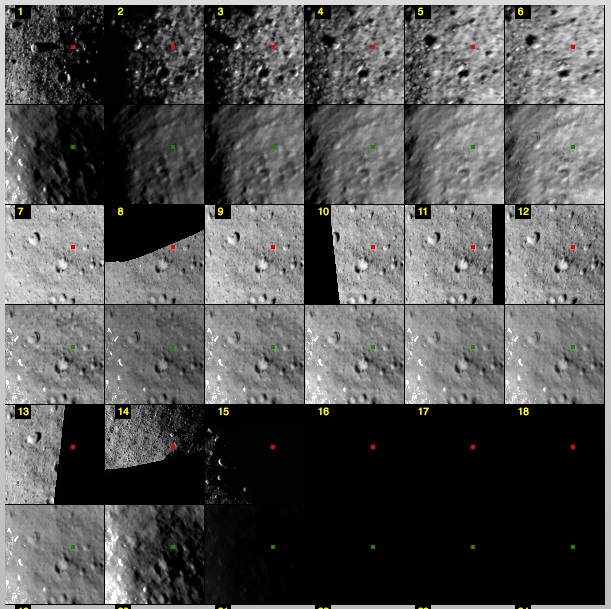
As can be seen, the first image appears to be correlated, but now the fourteenth image is all messed up. At this moment it worth visually inspecting the images for any irregularities. The best way to visually inspect the images is to use the updateDisplay tool Eric provided. See the updateDisplay tool for instructions on how to set up and use.
The maplets for landmark EM0004 look like this.

