|
Size: 12018
Comment:
|
Size: 12024
Comment:
|
| Deletions are marked like this. | Additions are marked like this. |
| Line 191: | Line 191: |
| || || ||RMS without Translation<<BR>>or Rotation (cm)||RMS with Optimal<<BR>>Translation (cm)||RMS without Translation<<BR>>or Rotation (cm)||RMS with Optimal<<BR>>Translation and Rotation (cm)||RMS with Optimal<<BR>>Translation (cm)|| | || || ||RMS without Translation<<BR>>or Rotation (cm)||RMS with Optimal<<BR>>Translation (cm)||RMS with Optimal<<BR>>Translation and Rotation (cm)||RMS with Optimal<<BR>>Translation and Rotation (cm)||RMS with Optimal<<BR>>Translation (cm)|| |
Test 05: OptimalF2
Aim and Objectives
Purpose of test: To obtain highest possible topographic accuracy and resolution for TAG site 1, given perfect camera position and pointing and optimal SPC image suite.
Additional Objectives
- To obtain user-in-the-loop and server-in-the-loop RMS error variations.
- To obtain user-in-the-loop procedural variation.
- To obtain beginner/expert user variation.
Acronyms
DTM |
Digital Terrain Model |
GSD |
Ground Sample Distance |
RMS |
Root Mean Square |
SPC |
Stereophotoclinometry |
TAG |
Touch And Go |
Definitions and Disambiguation
Formal Uncertainty |
The RMS landmark position uncertainty of the bigmap as output by the utility program RESIDUALS. |
CompareOBJ RMS |
RMS per-sample distance to nearest truth surface point as output by the utility program CompareOBJ. |
Methodology
Data
- Data was generated by Imager_mg using shape3.8 on ormacsrv1.
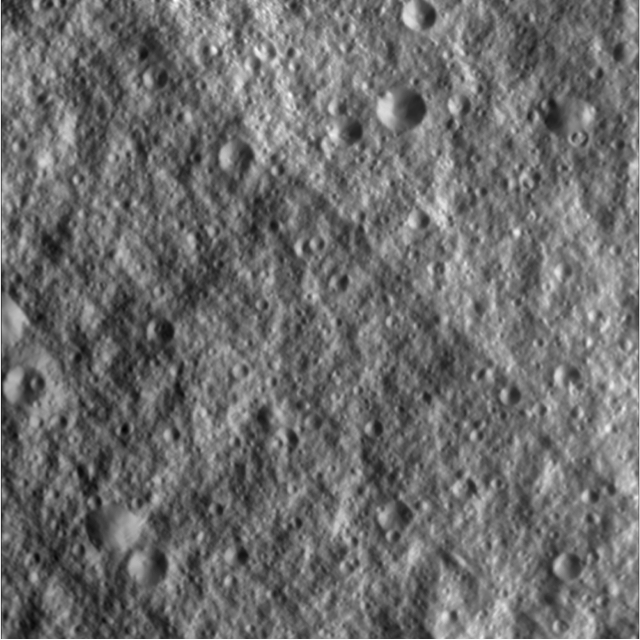
- PT10A - Centered at the middle of TAG site one.
- Image Suite: Optimal flight path, image resolutions: 50cm, 20cm, 10cm, 5cm.
- S/C:
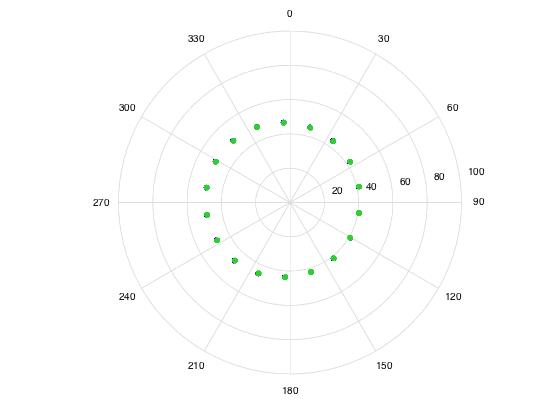
- Every 20° azimuth angle, 45° zenith angle
- Sun:
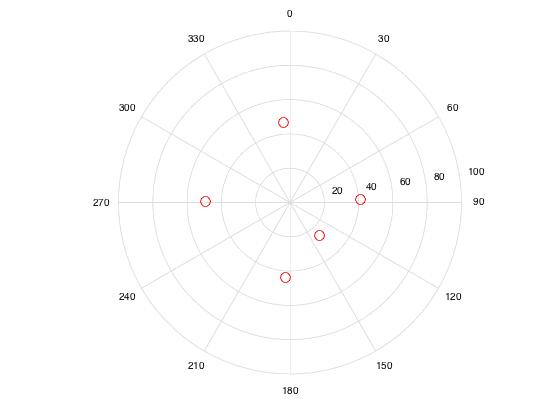
- 0, 90°, 180°, 270° azimuth angle, 45 zenith angle
- 135° azimuth angle, 30° zenith angle
- S/C:
Spacecraft:
Sun:
User/Server-in-the-loop:
User |
Experience |
Server |
Number of Core Processors |
TCampbell |
Intermediate |
?Ormacsrv2 |
?8 |
KDrozd |
Intermediate |
Ormacsrv1 |
8 |
DLambert |
Beginner |
Ormacsrv3 |
6 |
EPalmer |
Experienced |
? |
? |
JWeirich |
Intermediate |
DD |
12 |
Bigmaps
The following TAG1 bigmaps were tiled/iterated and evaluated:
Starting topography defined from: START1.MAP:
- GSD = 25cm;
- Q size = 150;
- width = 75m;
- center lat/wlong = -8.027, 262.768.
DTM Bigmap parameters:
Step |
GSD(cm) |
Overlap Factor |
Approx. Overlap Percentage |
Q Size |
Width |
35cm-Tiling |
35 |
1.3 |
60% |
112 |
60m |
18cm-Tiling |
18 |
1.3 |
60% |
217 |
61m |
9cm-Tiling |
9 |
1.3 |
60% |
434 |
61m |
5cm-Tiling |
5 |
1.3 |
60% |
780 |
62m |
Evaluation Bigmap parameters:
- GSD = 5cm;
- Q size = 500;
- width = 50m;
Tiling Parameters
Tiling parameters may have varied between users:
Parameter |
TCampbell |
KDrozd |
DLambert |
EPalmer |
JWeirich |
Image elimination: INVLIM |
0 |
0 |
0 |
? |
0 |
Image elimination: SLIM |
60 (@35cm), 50 (o.w.) |
50 |
60 (@35cm), 50 (o.w.) |
? |
50 |
Image elimination: CLIM |
.5 |
.5 |
.5 |
? |
.5 |
Image elimination: ILIM |
.5 |
.5 |
.5 |
? |
.5 |
Image elimination: RSMIN |
0 (@35cm), .25 (o.w.) |
.25 |
0 (@35cm), .25 (o.w.) |
? |
.25 |
Image elimination: RSMAX |
3 |
3 |
3 |
? |
3 |
Calculate Central Vector (v, 1) |
YES |
YES |
YES |
? |
YES |
Differential Stereo (2, 6) |
YES |
YES |
YES |
? |
YES |
Shadows (2, 7) |
NO |
NO |
NO |
? |
NO |
alpha-numerics in brackets refer to Lithos/LithosP menu options.
Iteration Parameters
Iteration parameters varied between users:
Parameter |
TCampbell |
KDrozd |
DLambert |
EPalmer |
JWeirich |
Reset albedo/slopes (a, y, y) |
NO |
YES |
YES |
? |
YES |
Calculate Central Vector (v, 1) |
YES |
YES |
YES |
? |
YES |
Differential Stereo (2, 6) |
NO |
NO |
NO |
? |
NO |
Shadows (2, 7) |
NO |
YES |
NO |
? |
YES |
alpha-numerics in brackets refer to Lithos/LithosP menu options.
Results
Please see Tables and Figures.
Discussion
User Differences in Tiling and Iteration Parameters
The only differences in tiling parameters pertain to the auto-elimination of images during the initial 35cm tiling. The maximum permissible emission angle varied between 50 and 60 degrees. The minimum allowable ration between image scale and misplace varied between 0 and 0.25. All other tiling step parameters were the same between users.
Iteration parameters however varied greatly between users, with no two users applying an identical set of parameters. All users calculated the central vector (v1), however not all users reset albedo/slopes, conditioned with differential stereo and/or conditioned with shadows.
User Differences in Processing Steps
Since users had different criteria for triggering the cessation of iteration and continuing to the next tiling step (such as 2 iterations per tiling step, or, no further change in evaluation statistics), users iterated solutions a varied number of times.
Number of iterations conducted at each GSD step:
Processing Step |
TCampbell |
KDrozd |
DLambert |
EPalmer |
JWeirich |
35cm Iterations |
2 |
6 |
5 |
6 |
2 |
18cm Iterations |
2 |
2 |
6 |
1 |
2 |
9cm Iterations |
2 |
1 |
2 |
- |
2 |
5cm Iterations |
2 |
- |
- |
- |
1 |
User Errors
Additionally, two users applied incorrect or non-standard processing procedures for some portion of the test related to their level of experience and training:
- DLambert calculated statistics on an incorrectly sized evaluation bigmap during the 35cm tiling and first iteration leading to loss of statistics data for these processing steps;
- DLambert failed to eliminate low correlating images during the first three 35cm iteration steps, leading to initial problems in the topography which are reflected in the formal uncertainties and RMS errors. The errors receded at the 18cm tiling step.
- KDrozd used different parameters in the utility program FITS2OBJ, upstream of obtaining the CompareOBJ RMS error, as other team members, leading to differing RMS error statistics which do not necessarily reflect differences in the evaluation bigmap compared to other users' evaluation bigmaps.
User Differences in Evaluation Statistics
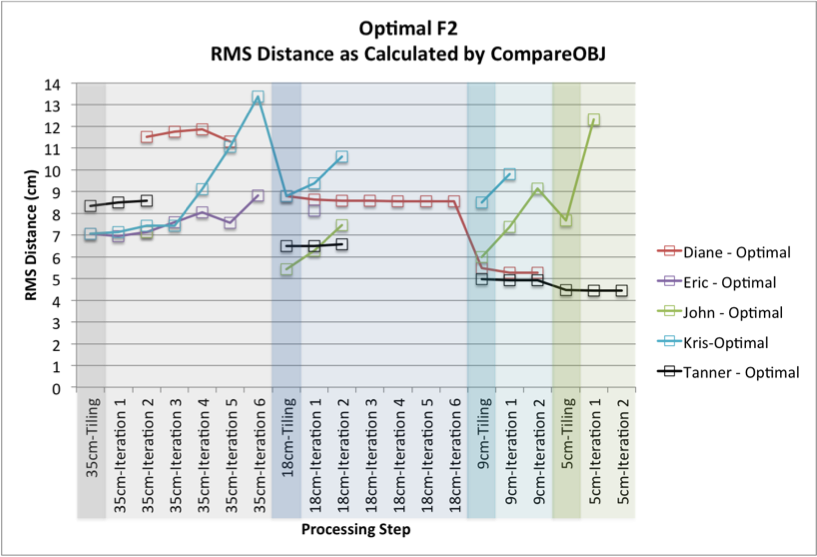
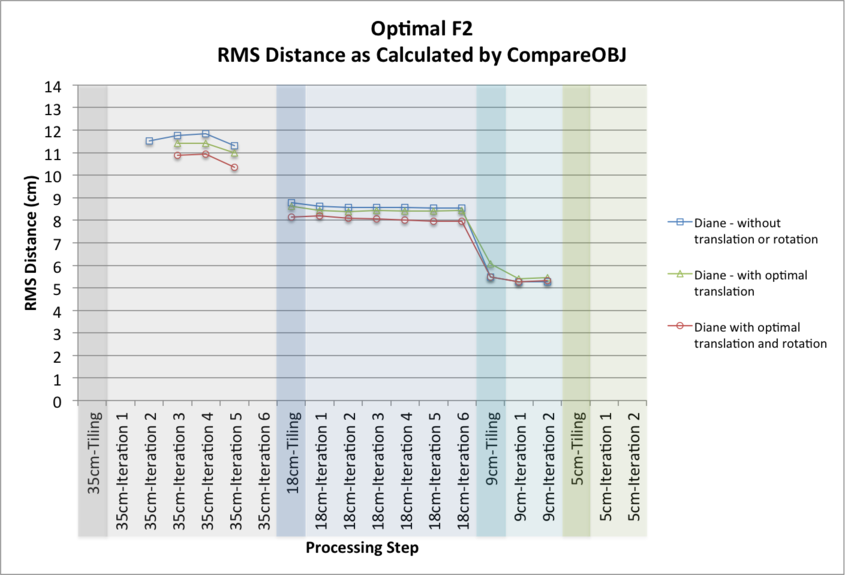
CompareOBJ RMS errors show large variation from user to user. Some of these variations can be directly linked to user procedural differences, for example the high RMS errors through the 35cm iterations for DLambert and KDrozd are directly related to incorrect and non-standard processing (see above section). Other differences reflect some combination of:
- variation in iteration parameters (see above section);
- variation in number of iterations conducted;
- variation in user skill and experience in manually registering/eliminating problem images;
- server-based variation;
- number-of-core-processors-based variation:
- SPC uncertainty due to random seeds utilized in maplet slope and height calculations.
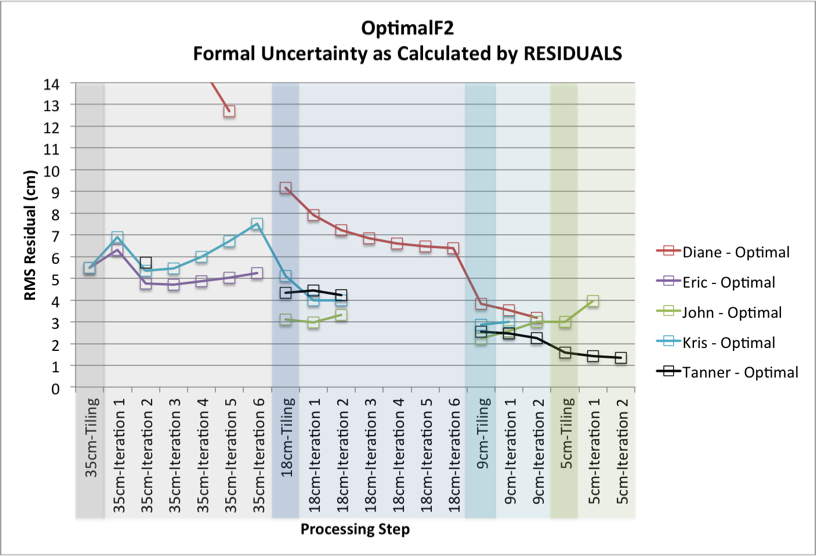
Formal uncertainties were more similar between users, differences can be directly linked to user procedural differences, specifically incorrect and non-standard processing covered in the previous section.
Overall SPC Performance
All users obtain formal uncertainties below the highest image resolution (< 5cm).
Final CompareOBJ RMS errors vary. The two final solutions which reached a GSD of 5cm obtained an RMS error of 12.3cm and 4.5cm. Slight improvements in CompareOBJ RMS can be gained by using the CompareOBJ optimal translation/rotation utilities.
Conclusions and Recommendations
Formal uncertainties performed well in respect to both between-user variation and final performance measures. However, the CompareOBJ RMS error did not, showing high variability user-to-user and high variability in final performance measures.
User-to-user differences can be minimized in future testing through a combination of standardization of tiling/iteration parameters and iteration cessation criteria, and increase in user skill and experience.
Tiling and iteration parameters should be investigated to find the best-practice for standardized seed file sets. This recommendation is addressed in Test06 - FindHeights.
To further investigate the performance of SPC with perfect camera position and pointing and optimal viewing conditions, a suite of higher-resolution images will be added and the best performing 5cm DTM will be tiled and iterated at higher ground sample distances. This recommendation led to the implementation of Test08 - OptimalUltraF2.
Tables and Figures
RMS Distance (cm) - Compare OBJ (with no translation/rotation)
Resolution (cm) |
Step |
Diane |
Eric |
John |
Kris |
Tanner |
35 |
35cm-Tiling |
|
7.06 |
|
7.06 |
8.35 |
35 |
35cm-Iteration 1 |
|
6.95 |
|
7.15 |
8.49 |
35 |
35cm-Iteration 2 |
11.51 |
7.15 |
7.13 |
7.44 |
8.58 |
35 |
35cm-Iteration 3 |
11.76 |
7.6 |
|
7.44 |
|
35 |
35cm-Iteration 4 |
11.85 |
8.04 |
|
9.10 |
|
35 |
35cm-Iteration 5 |
11.31 |
7.57 |
|
11.05 |
|
35 |
35cm-Iteration 6 |
|
8.81 |
|
13.39 |
|
18 |
18cm-Tiling |
8.78 |
|
5.43 |
8.79 |
6.49 |
18 |
18cm-Iteration 1 |
8.62 |
8.12 |
6.29 |
9.37 |
6.50 |
18 |
18cm-Iteration 2 |
8.57 |
|
7.45 |
10.60 |
6.58 |
18 |
18cm-Iteration 3 |
8.57 |
|
|
|
|
18 |
18cm-Iteration 4 |
8.56 |
|
|
|
|
18 |
18cm-Iteration 5 |
8.55 |
|
|
|
|
18 |
18cm-Iteration 6 |
8.54 |
|
|
|
|
9 |
9cm-Tiling |
5.47 |
|
6.00 |
8.49 |
4.98 |
9 |
9cm-Iteration 1 |
5.28 |
|
7.39 |
9.80 |
4.92 |
9 |
9cm-Iteration 2 |
5.27 |
|
9.15 |
|
4.92 |
5 |
5cm-Tiling |
|
|
7.68 |
|
4.47 |
5 |
5cm-Iteration 1 |
|
|
12.31 |
|
4.44 |
5 |
5cm-Iteration 2 |
|
|
|
|
4.45 |
RMS Distance (cm) - Compare OBJ (with optimal translation/rotation)
Resolution (cm) |
Step |
Diane |
Kris |
|||
|
|
RMS without Translation |
RMS with Optimal |
RMS with Optimal |
RMS with Optimal |
RMS with Optimal |
35 |
35cm-Tiling |
|
|
|
7.06 |
|
35 |
35cm-Iteration 1 |
|
|
|
7.15 |
|
35 |
35cm-Iteration 2 |
11.51 |
|
7.44 |
|
|
35 |
35cm-Iteration 3 |
11.76 |
11.40 |
10.89 |
7.44 |
|
35 |
35cm-Iteration 4 |
11.85 |
11.40 |
10.92 |
9.10 |
|
35 |
35cm-Iteration 5 |
11.31 |
10.98 |
10.35 |
11.05 |
|
35 |
35cm-Iteration 6 |
|
|
|
13.39 |
|
18 |
18cm-Tiling |
8.62 |
8.78 |
8.15 |
8.79 |
|
18 |
18cm-Iteration 1 |
8.62 |
8.44 |
8.19 |
9.37 |
|
18 |
18cm-Iteration 2 |
8.57 |
8.38 |
8.09 |
10.60 |
|
18 |
18cm-Iteration 3 |
8.57 |
8.44 |
8.06 |
|
|
18 |
18cm-Iteration 4 |
8.56 |
8.40 |
8.02 |
|
|
18 |
18cm-Iteration 5 |
8.55 |
8.41 |
7.96 |
|
|
18 |
18cm-Iteration 6 |
8.54 |
8.44 |
7.96 |
|
|
9 |
9cm-Tiling |
5.47 |
6.06 |
5.49 |
8.49 |
|
9 |
9cm-Iteration 1 |
5.28 |
5.40 |
5.26 |
9.80 |
|
9 |
9cm-Iteration 2 |
5.27 |
5.45 |
5.32 |
|
6.13 |
5 |
5cm-Tiling |
|
|
|
|
|
5 |
5cm-Iteration 1 |
|
|
|
|
|
5 |
5cm-Iteration 2 |
|
|
|
|
|
Formal Uncertainty (cm) - RESIDUALS
Resolution (cm) |
Step |
Diane |
Eric |
John |
Kris |
Tanner |
|
35 |
35cm-Tiling |
|
5.48 |
|
5.49 |
|
|
35 |
35cm-Iteration 1 |
|
6.32 |
|
6.91 |
|
|
35 |
35cm-Iteration 2 |
29.78 |
4.76 |
|
5.36 |
5.72 |
|
35 |
35cm-Iteration 3 |
39.12 |
4.71 |
|
5.45 |
|
|
35 |
35cm-Iteration 4 |
14.74 |
4.87 |
|
5.98 |
|
|
35 |
35cm-Iteration 5 |
12.69 |
5.04 |
|
6.72 |
|
|
35 |
35cm-Iteration 6 |
|
5.23 |
|
7.51 |
|
|
18 |
18cm-Tiling |
8.78 |
9.17 |
|
3.12 |
5.11 |
4.34 |
18 |
18cm-Iteration 1 |
7.90 |
|
2.97 |
3.98 |
4.45 |
|
18 |
18cm-Iteration 2 |
7.23 |
|
3.33 |
3.98 |
4.22 |
|
18 |
18cm-Iteration 3 |
6.84 |
|
|
|
|
|
18 |
18cm-Iteration 4 |
6.61 |
|
|
|
|
|
18 |
18cm-Iteration 5 |
6.47 |
|
|
|
|
|
18 |
18cm-Iteration 6 |
6.40 |
|
|
|
|
|
9 |
9cm-Tiling |
3.82 |
|
2.24 |
2.86 |
2.54 |
|
9 |
9cm-Iteration 1 |
3.53 |
|
2.57 |
2.99 |
2.46 |
|
9 |
9cm-Iteration 2 |
3.18 |
|
3.01 |
|
2.26 |
|
5 |
5cm-Tiling |
|
|
2.99 |
|
1.59 |
|
5 |
5cm-Iteration 1 |
|
|
3.97 |
|
1.43 |
|
5 |
5cm-Iteration 2 |
|
|
|
|
1.35 |
35cm GSD Maplets - 50cm Resolution Images 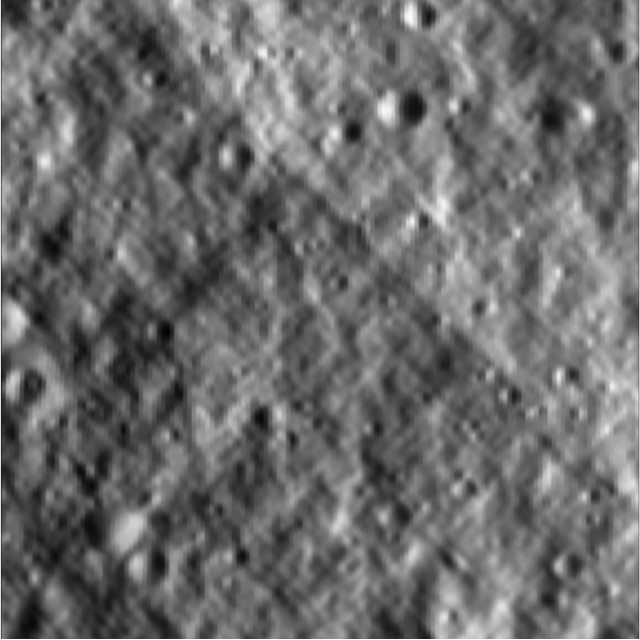
18cm GSD Maplets - 20cm Resolution Images 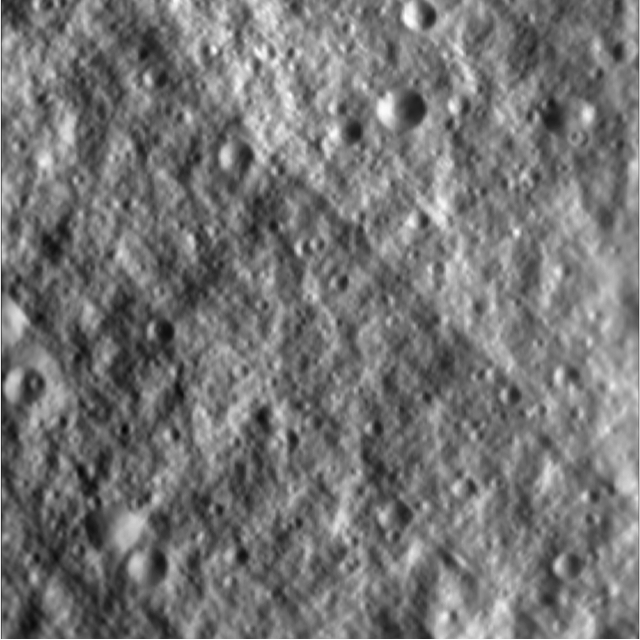
9cm GSD Maplets - 10cm Resolution Images 