|
Size: 385
Comment:
|
Size: 1065
Comment:
|
| Deletions are marked like this. | Additions are marked like this. |
| Line 7: | Line 7: |
| {{attachment:CompOBJ.png||width="800"}} {{attachment:CompOBJ.png||width="800"}} |
|
| Line 11: | Line 14: |
| {{attachment:trace_F_multiple_iterations.png||width="800"}} {{attachment:trace_FWE_multiple_iterations.png||width="800"}} |
|
| Line 14: | Line 20: |
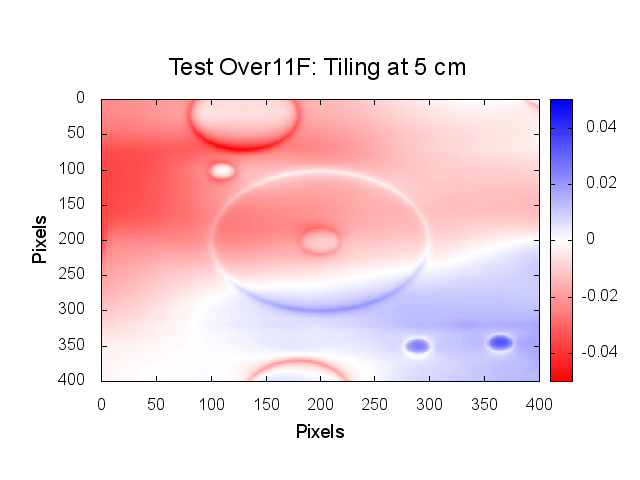
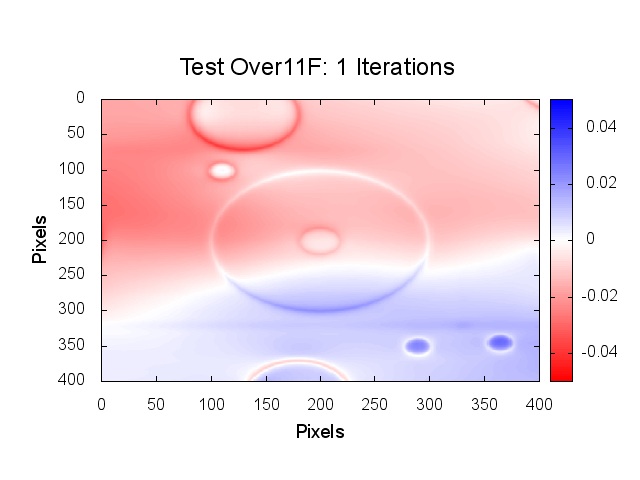
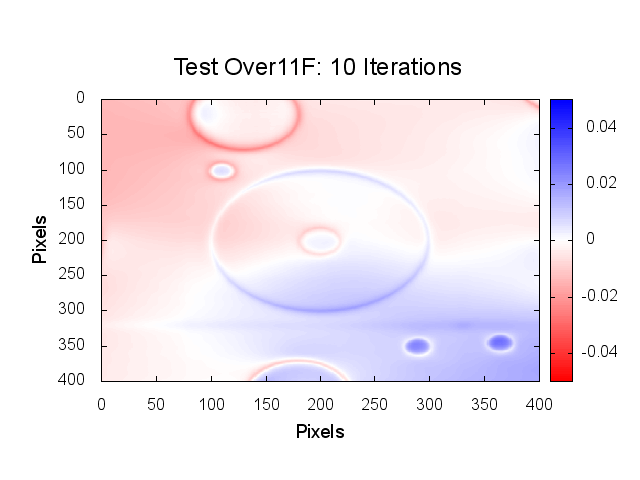
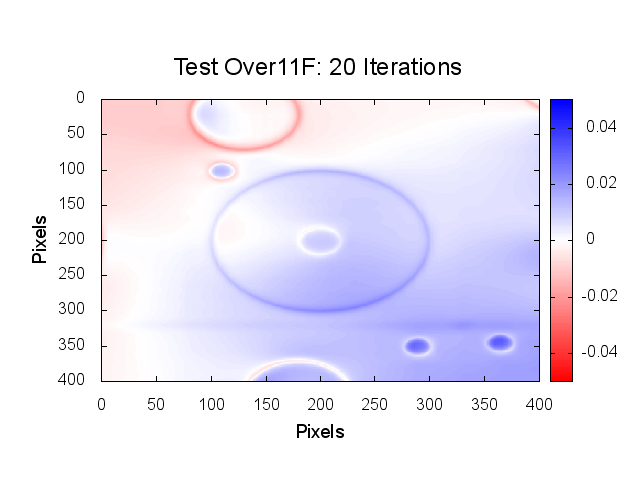
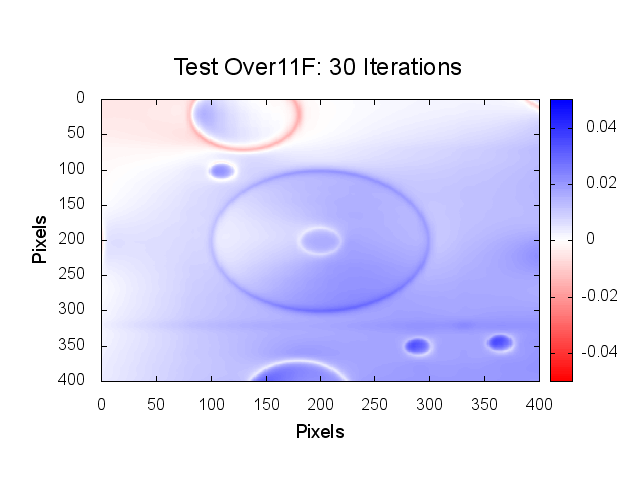
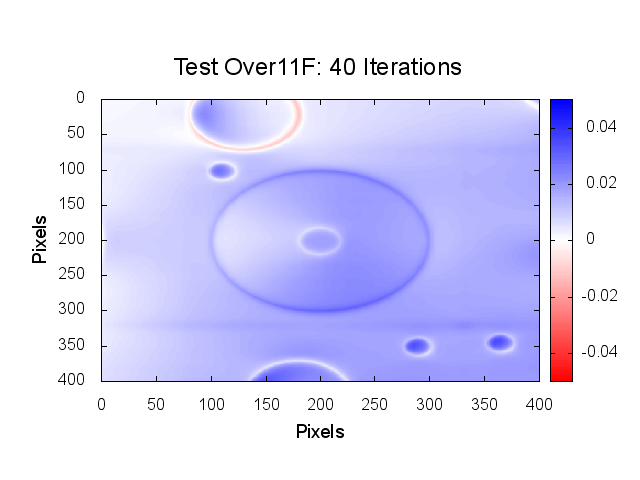
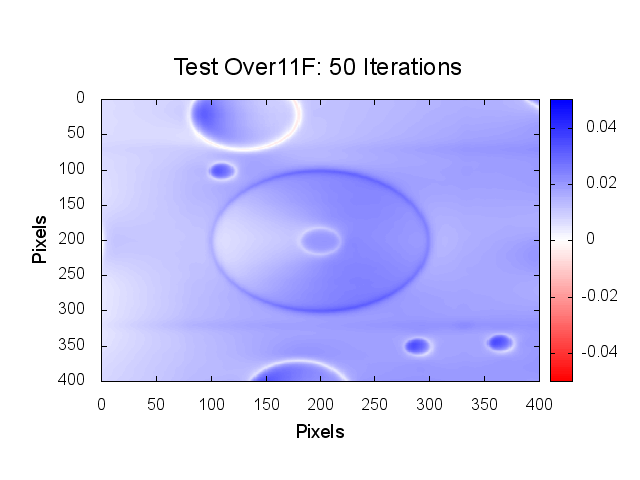
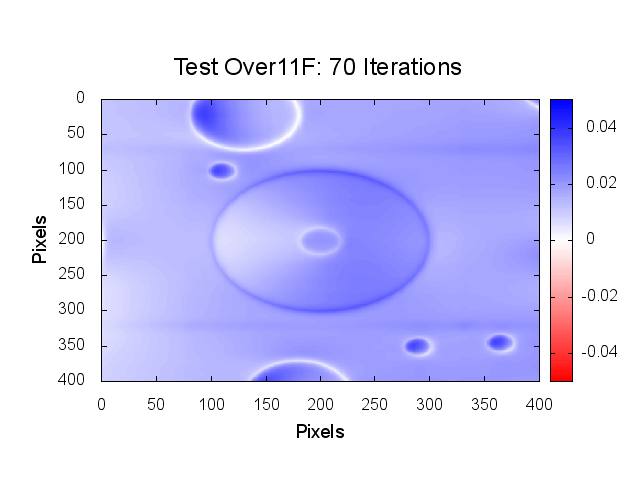
{{attachment:Heat_Maps_F0.png||width="800"}} {{attachment:Heat_Maps_F1.png||width="800"}} {{attachment:Heat_Maps_F10.png||width="800"}} {{attachment:Heat_Maps_F20.png||width="800"}} {{attachment:Heat_Maps_F30.png||width="800"}} {{attachment:Heat_Maps_F40.png||width="800"}} {{attachment:Heat_Maps_F50.png||width="800"}} {{attachment:Heat_Maps_F60.png||width="800"}} {{attachment:Heat_Maps_F70.png||width="800"}} {{attachment:Heat_Maps_F80.png||width="800"}} |
Test Over11F Results
Measurement Line Graphs
Line graphs showing various methods and a table, YAY!.
Traces
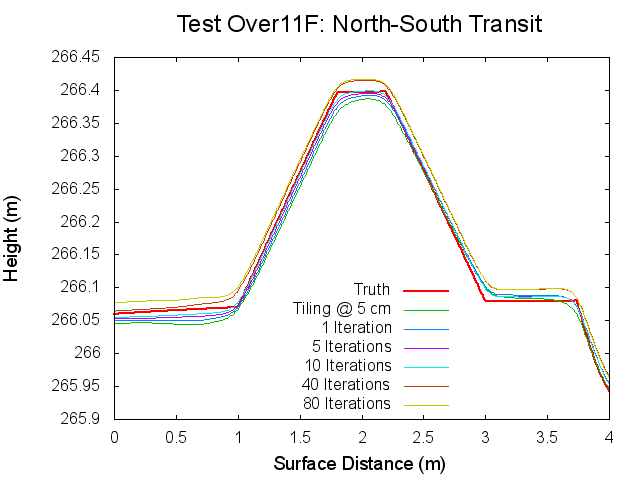
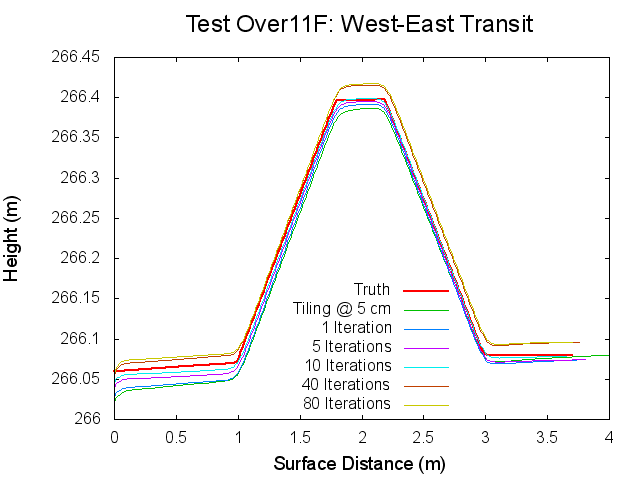
These graphs show the North to South and the West to East traces for various iterations of this test.
Deviation Heat Maps
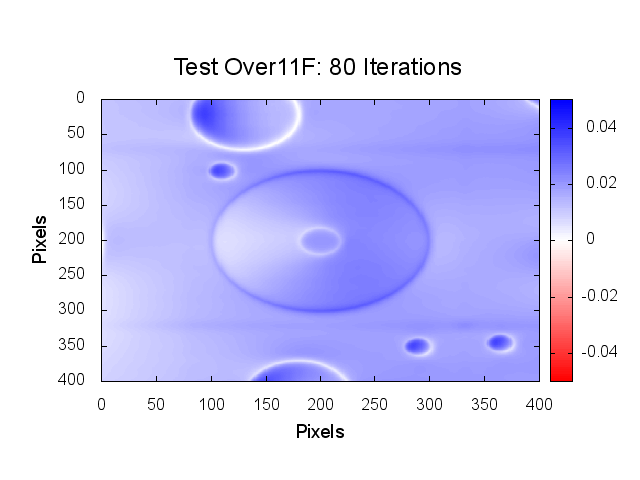
Topographical map where the colors indicate the calculated height difference between the Truth and Effort bigmap.
