|
Size: 1813
Comment:
|
← Revision 42 as of 2015-12-16 16:45:24 ⇥
Size: 4759
Comment:
|
| Deletions are marked like this. | Additions are marked like this. |
| Line 1: | Line 1: |
| = Spacecraft Zenith Variations: Comparison of Results = | ## page was renamed from Test11STU Comparative Results ## page was renamed from Spacecraft Zenith Variations ## page was renamed from Comparison = Spacecraft Zenith Variations = |
| Line 3: | Line 6: |
| == Discussion == | == Test Over11 S/T/U Comparative Results == |
| Line 7: | Line 11: |
| '''Figure 1: Minima''' {{attachment:Minima-resized.png}} |
=== Minima === |
| Line 12: | Line 14: |
| * Test U achieves the minimum value for every measure in the least number of iterations: 5 to 15 iterations sooner than Test T; and 15 to 20 iterations sooner than Test S (excluding Test S - CompMapVec RMS). * Test S consistently gives the largest RMS but the smallest formal uncertainty. * CompareOBJ RMS (with and without optimal translation and rotation varies across tests by less than 0.2cm, although Test U consistently archives the minimum RMS in significantly fewer iterations. |
* Test U achieves either the minimum value or within 0.03 cm of the minimum value for every RMS measure in the least number of iterations: 5 to 15 iterations sooner than Test T; and 15 to 20 iterations sooner than Test S (excluding Test S - CompMapVec RMS). * Test S consistently gives the largest RMS, with CompMapVec RMS showing no improvement from iterating. * CompareOBJ RMS (with and without optimal translation and rotation varies across tests by less than 0.2cm. === Formal Uncertainty and RMS === Residuals (Figure 2) maintain a value of approx. 3.1cm through the first 13 iterations, then decrease through the remainder of the first 50 iterations, seemingly forming an asymptote at approximately 1.4cm after approximately 55 iterations. Despite the continuing decrease in formal uncertainties, the CompareOBJ RMSs (figure 4) achieve their minima around 1.0cm within the first 10 to 30 iterations and then increase monotonically with iterating, possibly beginning to round off at 2.2cm, a higher value than that achieved with the corresponding tiling step. CompareOBJ with optimal translation and rotation (figure 5) achieves the minimum values around 0.5cm within 5 to 20 iterations. Increase in RMS is small with further iteration, remaining below 0.7cm. With such a differing behavior between CompareOBJ and CompareOBJ with optimal translation and rotation, the tilting and drifting behavior of the bigmap should be investigated. === Tilt === Comparison of the transit and heat plots shows that tilting and drifting behavior is consistent in direction and magnitude across tests S, T and U. '''Tiling:''' Before iterations begin, the North and West edges of the bigmap are low compared to the truth. South and East edges are on or below the truth. '''Iterations 1 to 40:''' The tilt worsens from the start of iteration to iteration 40 with the bigmap surface low on the North and West edges and high on the South and East edges. The mechanism driving the tilt appears to be the heightening of the South and East edges, although the entire bigmap increases in height through the iterations. '''Iterations 41 to 100:''' The tilt decreases through the remainder of the iterations, with the North and West edges increasing in height, reaching and then surpassing the height of the North and West edges of the truth topography. By 100 iterations, there is no discernible tilt remaining in the solution, but the entire solution is 2-4cm higher than the truth topography. |
| Line 18: | Line 46: |
| '''Formal Uncertainty''' | '''Figure 1: Minima''' |
| Line 20: | Line 48: |
| {{attachment:FormalUncertainty-resized.png}} | {{attachment:Minima-100-resized.png}} |
| Line 22: | Line 50: |
| '''CompMapVec RMS''' | '''Figure 2: Formal Uncertainty''' |
| Line 24: | Line 52: |
| {{attachment:CompMapVec-resized.png}} | {{attachment:FormalUncertainty-100-resized.png}} |
| Line 26: | Line 54: |
| '''CompareOBJ RMS''' | '''Figure 3: CompMapVec RMS''' |
| Line 28: | Line 56: |
| {{attachment:CompareOBJRMS-resized.png}} | {{attachment:CompMapVecRMS-100-resized.png}} |
| Line 30: | Line 58: |
| '''CompareOBJ With Opt Tran & Rot''' | '''Figure 4: CompareOBJ RMS''' |
| Line 32: | Line 60: |
| {{attachment:CompOBJwOptTranRot-resized.png}} | {{attachment:CompOBJRMS-100-resized.png}} |
| Line 34: | Line 62: |
| '''Traces Running North_South''' | '''Figure 5: CompareOBJ With Opt Tran & Rot''' {{attachment:CompOBJwOptTranRotRMS-100-resized.png}} '''Traces''' |
| Line 37: | Line 69: |
| {{attachment:transposedTransitIt20200.png}} | |
| Line 39: | Line 72: |
| {{attachment:transposedTransitIt40200.png}} | |
| Line 40: | Line 74: |
| '''Traces Running West-East''' | {{attachment:transitIt60200.png}} {{attachment:transposedTransitIt60200.png}} |
| Line 42: | Line 77: |
| {{attachment:transposedTransitIt20200.png}} | {{attachment:transitIt80200.png}} {{attachment:transposedTransitIt80200.png}} |
| Line 44: | Line 80: |
| {{attachment:transposedTransitIt40200.png}} | {{attachment:transitIt100200.png}} {{attachment:transposedTransitIt100200.png}} |
| Line 49: | Line 88: |
| Line 51: | Line 89: |
| Line 55: | Line 92: |
| {{attachment:heatPlot-T11RFT-05stepB040-1cm-4m.png}} {{attachment:heatPlot-T11RFU-05stepB040-1cm-4m.png}} |
|
| Line 56: | Line 95: |
| {{attachment:heatPlot-T11RFT-05stepB040-1cm-4m.png}} | {{attachment:heatPlot-T11RFS-05stepB060-1cm-4m.png}} {{attachment:heatPlot-T11RFT-05stepB060-1cm-4m.png}} {{attachment:heatPlot-T11RFU-05stepB060-1cm-4m.png}} |
| Line 58: | Line 99: |
| {{attachment:heatPlot-T11RFU-05stepB040-1cm-4m.png}} | {{attachment:heatPlot-T11RFS-05stepB080-1cm-4m.png}} {{attachment:heatPlot-T11RFT-05stepB080-1cm-4m.png}} {{attachment:heatPlot-T11RFU-05stepB080-1cm-4m.png}} {{attachment:heatPlot-T11RFS-05stepB100-1cm-4m.png}} {{attachment:heatPlot-T11RFT-05stepB100-1cm-4m.png}} {{attachment:heatPlot-T11RFU-05stepB100-1cm-4m.png}} |
Spacecraft Zenith Variations
Test Over11 S/T/U Comparative Results
The measures of accuracy are plotted for each test in figures ?? to ?? under Tables and Figures (below).
Minima
Figure 1 illustrates the minimum uncertainty and RMSs for each test, and at which iteration each minimum occurs. The following patterns are apparent:
Test U achieves either the minimum value or within 0.03 cm of the minimum value for every RMS measure in the least number of iterations: 5 to 15 iterations sooner than Test T; and 15 to 20 iterations sooner than Test S (excluding Test S - CompMapVec RMS).
Test S consistently gives the largest RMS, with CompMapVec RMS showing no improvement from iterating.
- CompareOBJ RMS (with and without optimal translation and rotation varies across tests by less than 0.2cm.
Formal Uncertainty and RMS
Residuals (Figure 2) maintain a value of approx. 3.1cm through the first 13 iterations, then decrease through the remainder of the first 50 iterations, seemingly forming an asymptote at approximately 1.4cm after approximately 55 iterations.
Despite the continuing decrease in formal uncertainties, the CompareOBJ RMSs (figure 4) achieve their minima around 1.0cm within the first 10 to 30 iterations and then increase monotonically with iterating, possibly beginning to round off at 2.2cm, a higher value than that achieved with the corresponding tiling step.
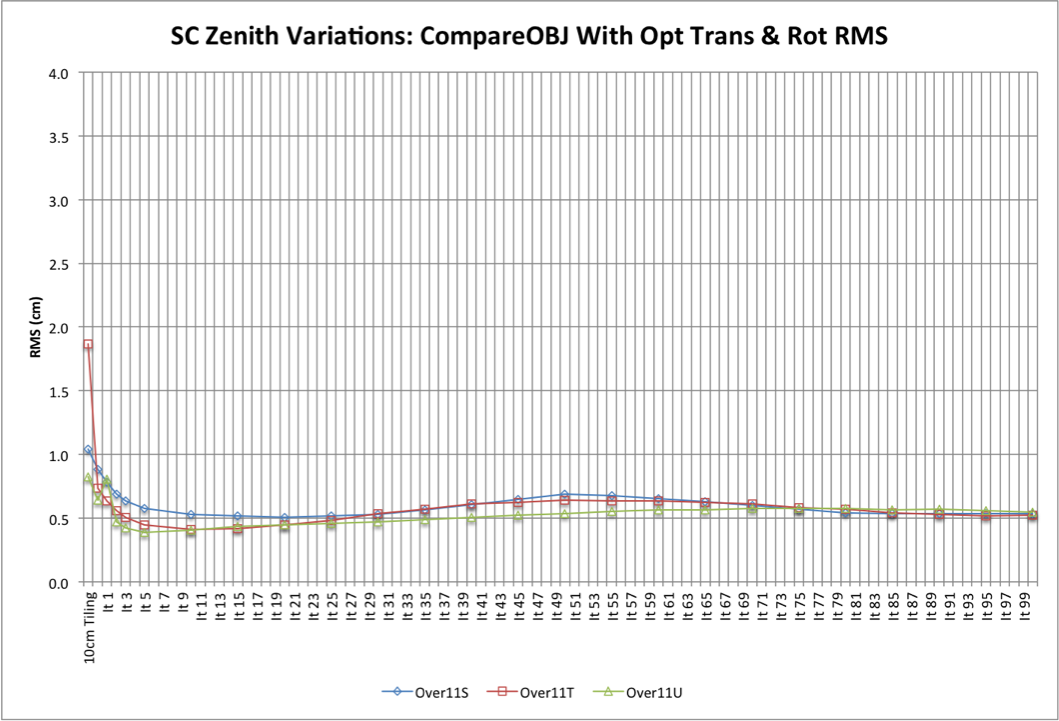
CompareOBJ with optimal translation and rotation (figure 5) achieves the minimum values around 0.5cm within 5 to 20 iterations. Increase in RMS is small with further iteration, remaining below 0.7cm.
With such a differing behavior between CompareOBJ and CompareOBJ with optimal translation and rotation, the tilting and drifting behavior of the bigmap should be investigated.
Tilt
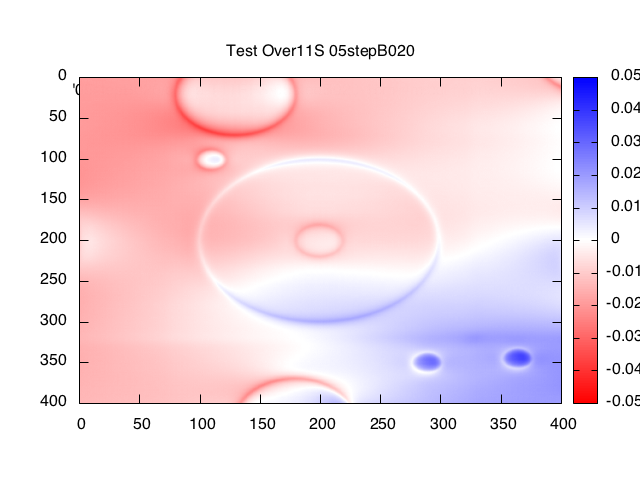
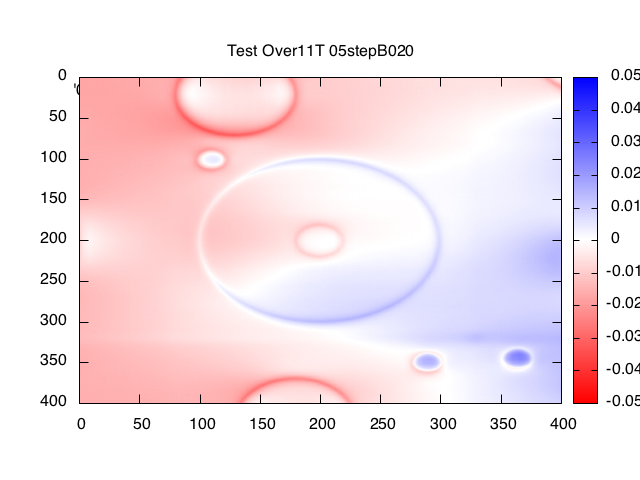
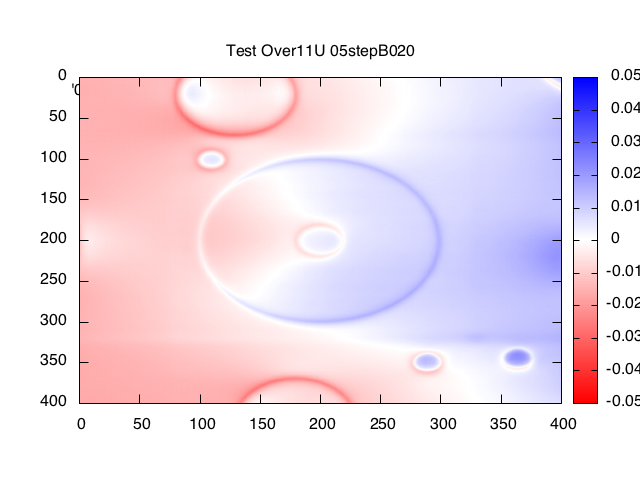
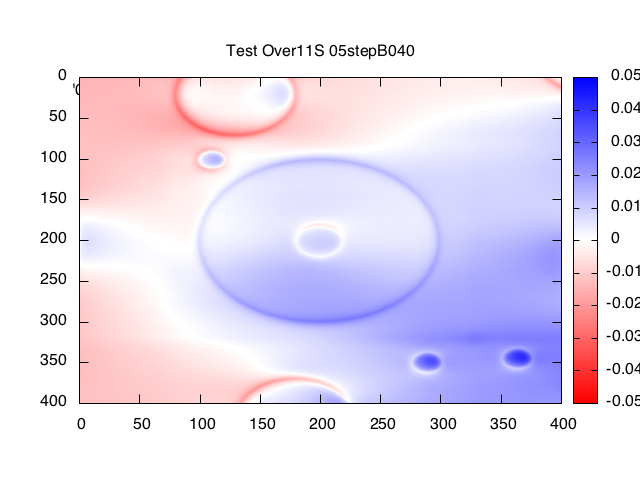
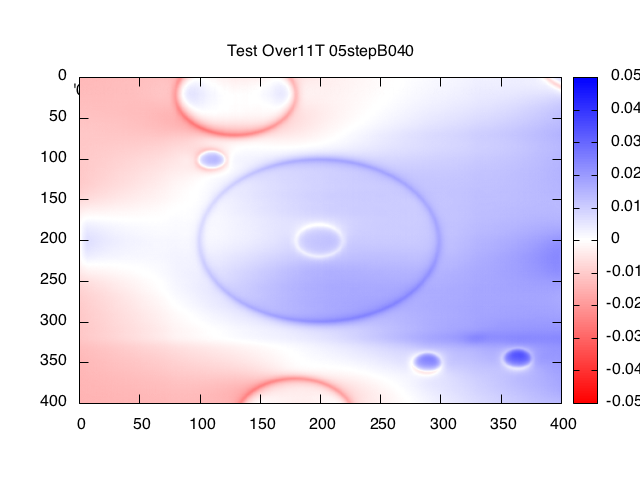
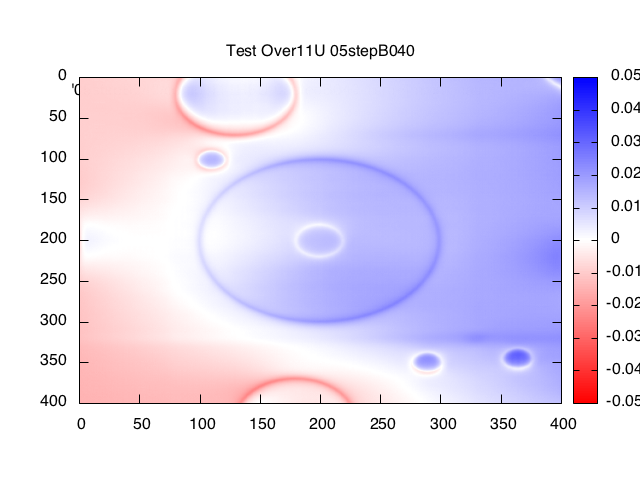
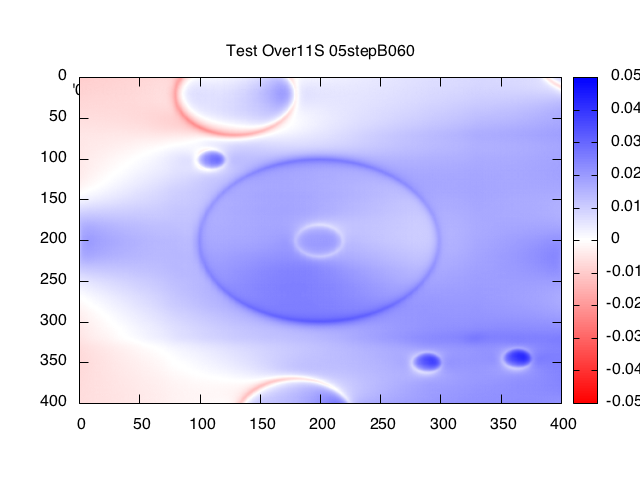
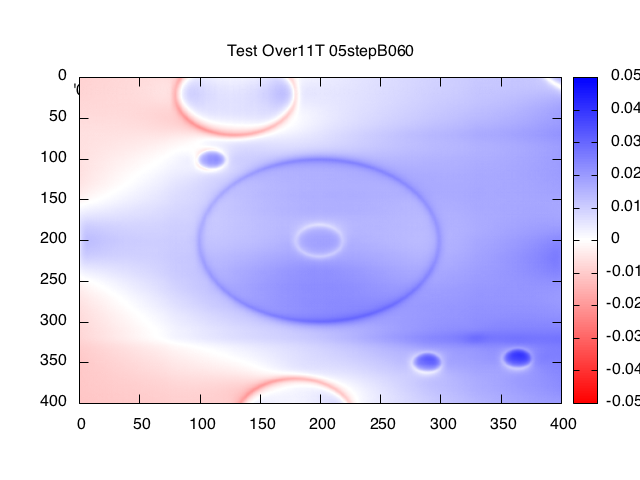
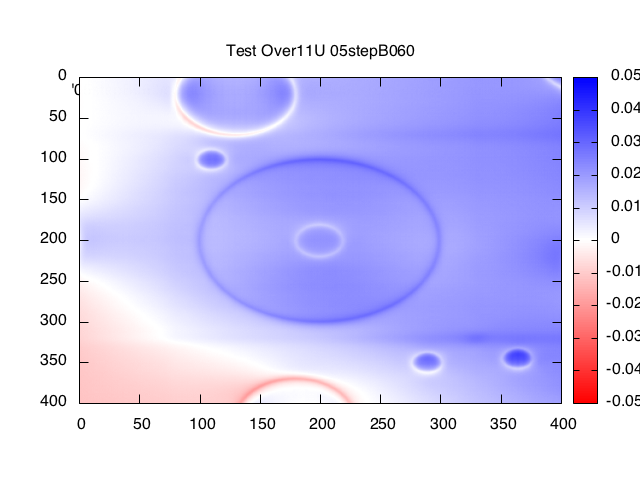
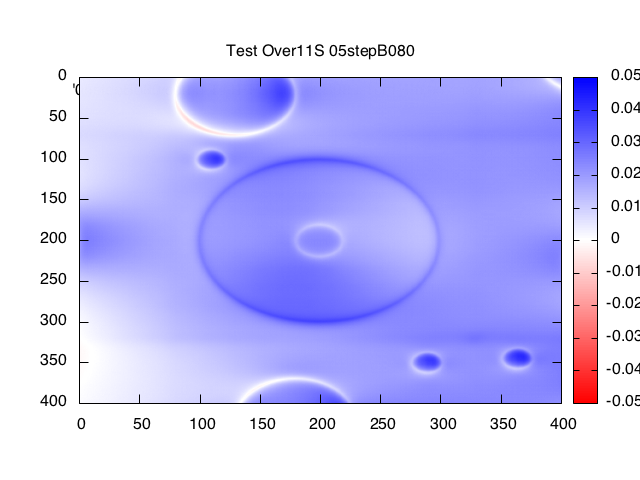
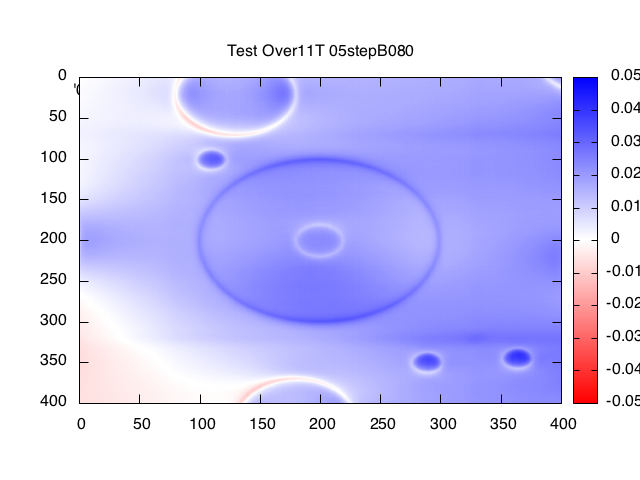
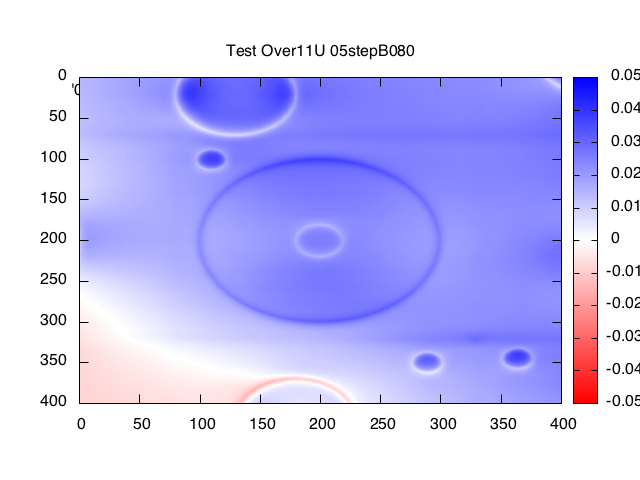
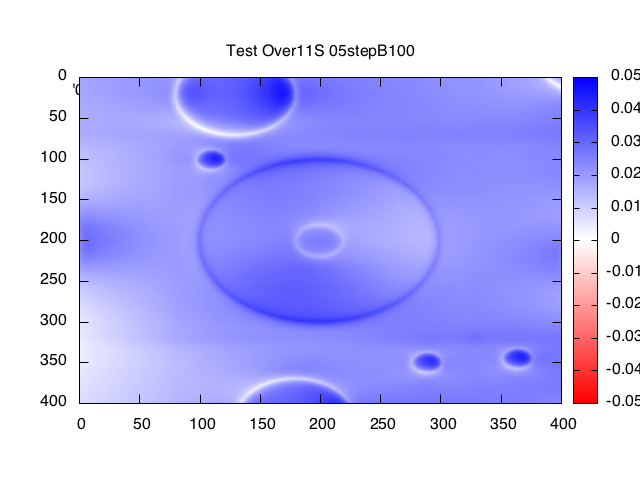
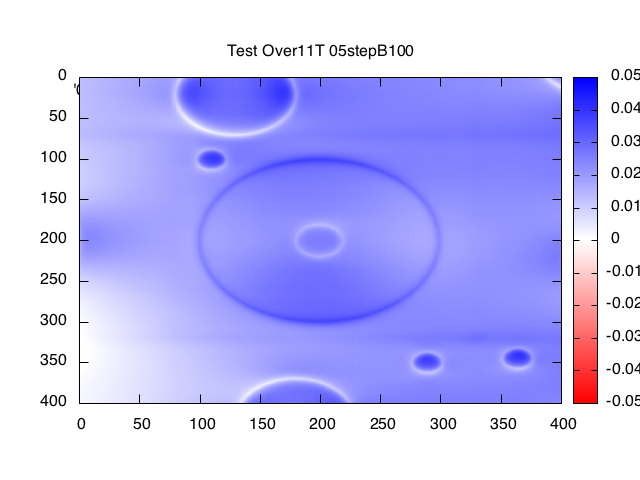
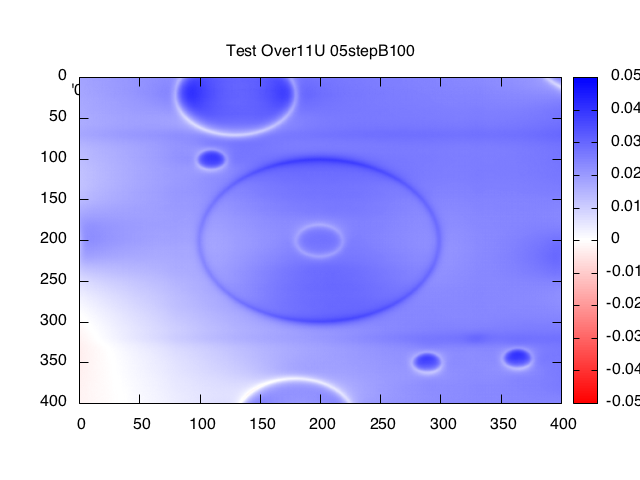
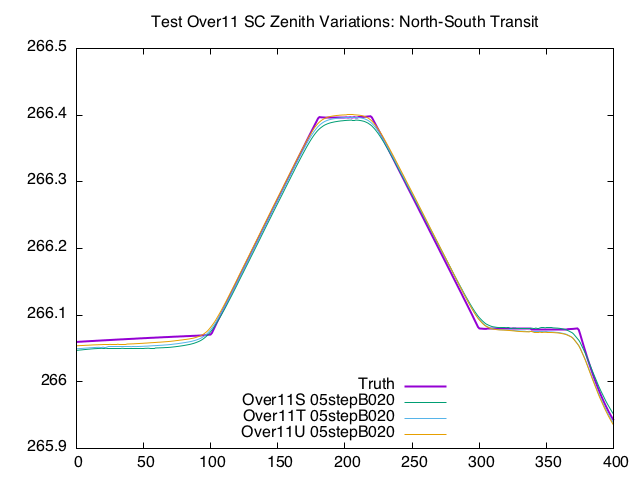
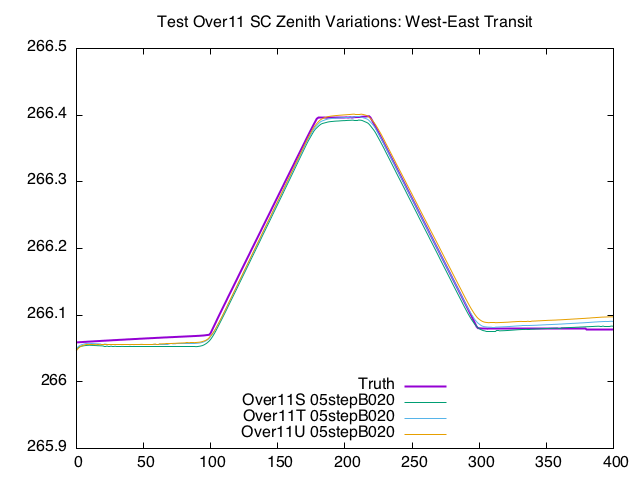
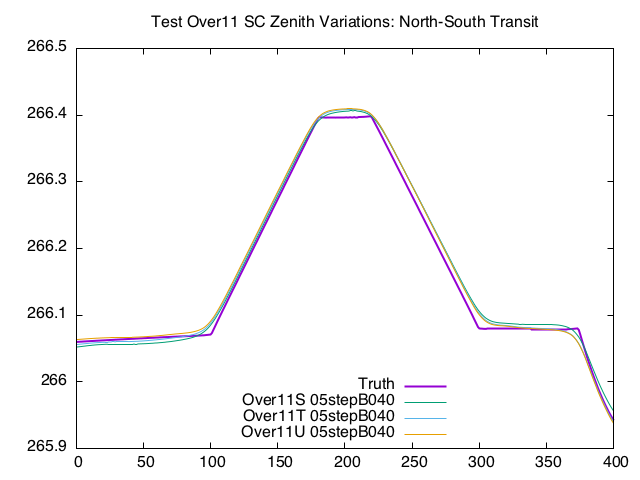
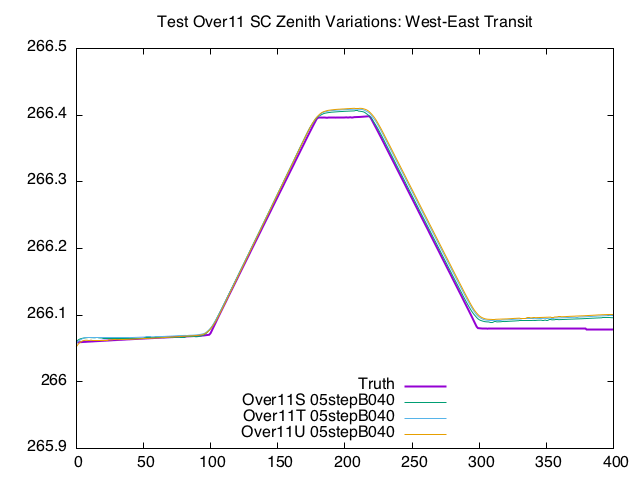
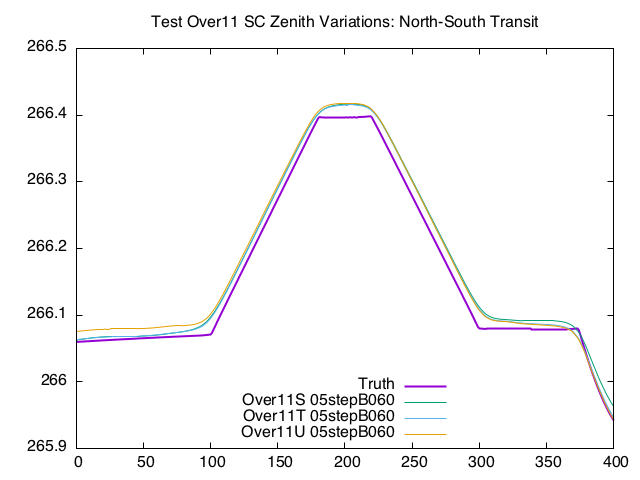
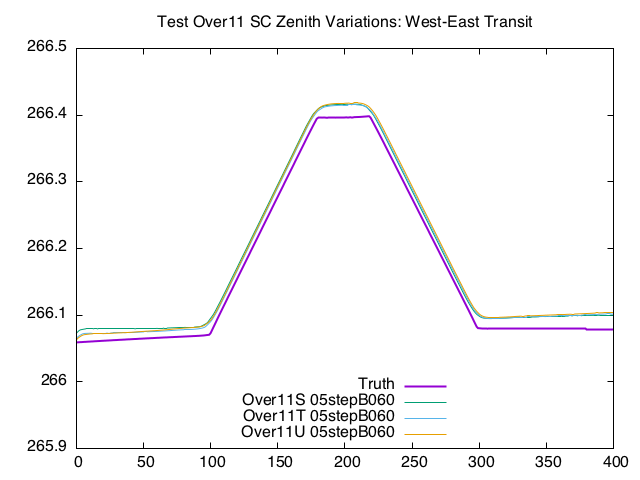
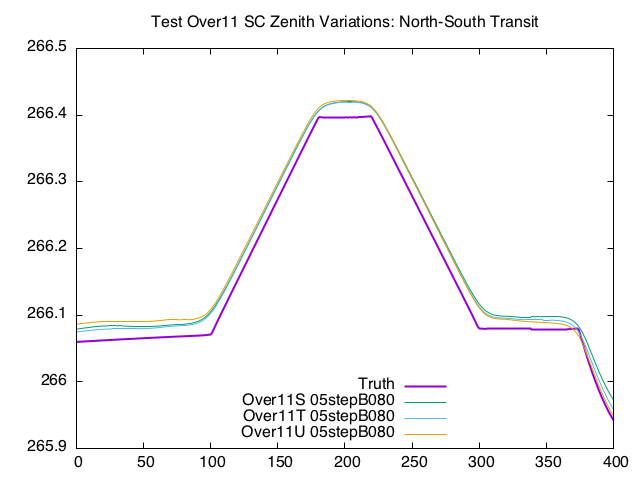
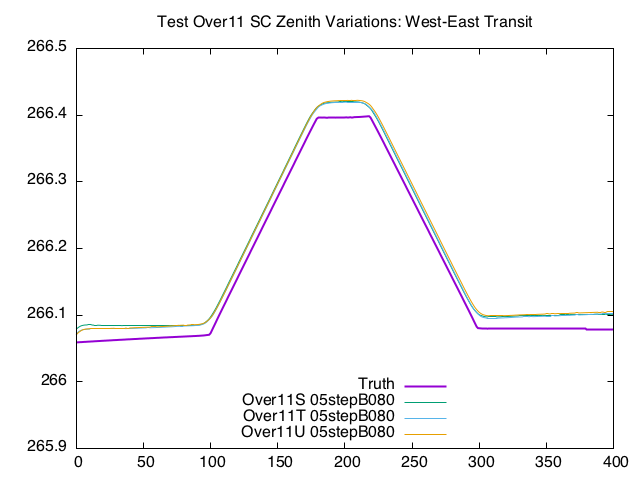
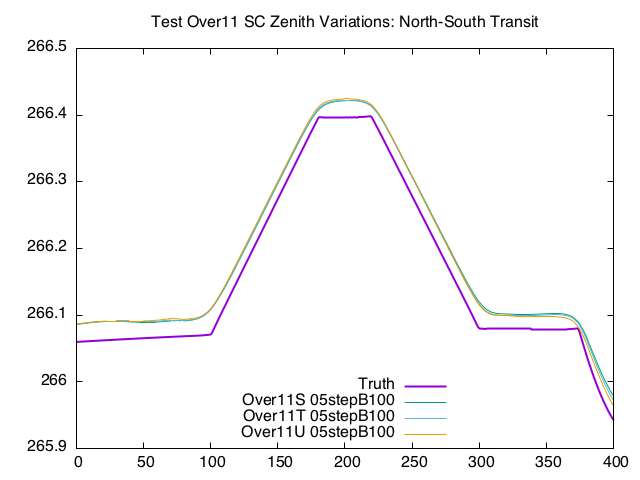
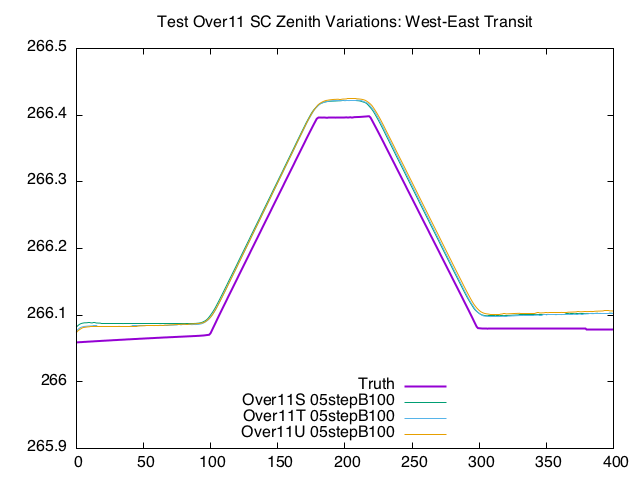
Comparison of the transit and heat plots shows that tilting and drifting behavior is consistent in direction and magnitude across tests S, T and U.
Tiling:
Before iterations begin, the North and West edges of the bigmap are low compared to the truth. South and East edges are on or below the truth.
Iterations 1 to 40:
The tilt worsens from the start of iteration to iteration 40 with the bigmap surface low on the North and West edges and high on the South and East edges. The mechanism driving the tilt appears to be the heightening of the South and East edges, although the entire bigmap increases in height through the iterations.
Iterations 41 to 100:
The tilt decreases through the remainder of the iterations, with the North and West edges increasing in height, reaching and then surpassing the height of the North and West edges of the truth topography. By 100 iterations, there is no discernible tilt remaining in the solution, but the entire solution is 2-4cm higher than the truth topography.
Tables and Figures
Figure 1: Minima
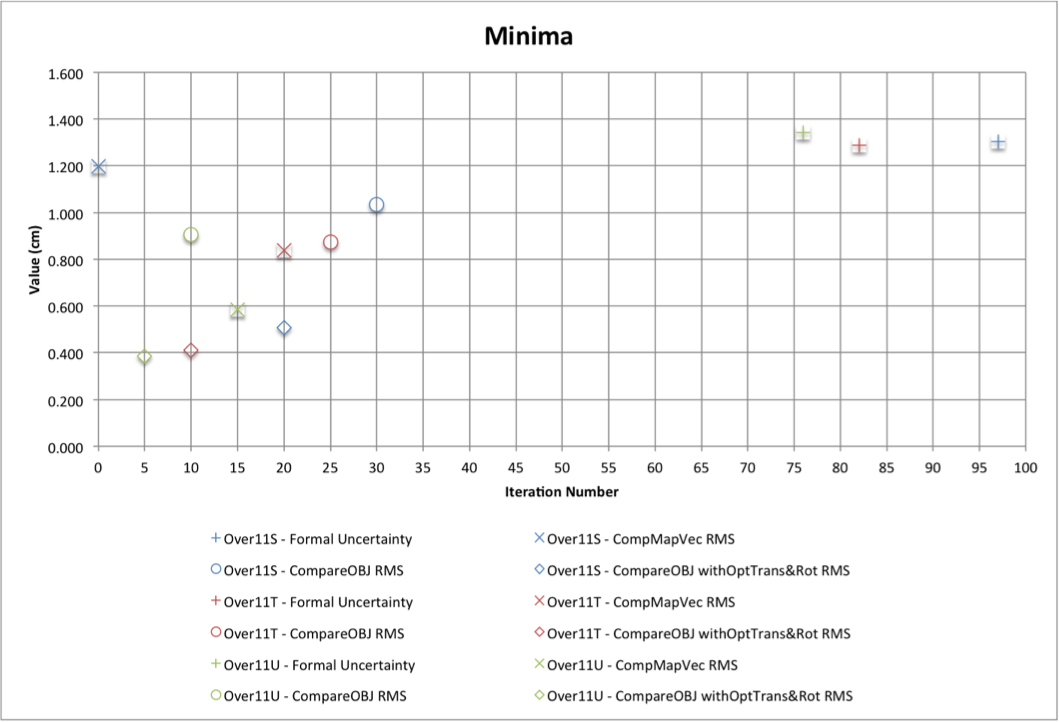
Figure 2: Formal Uncertainty
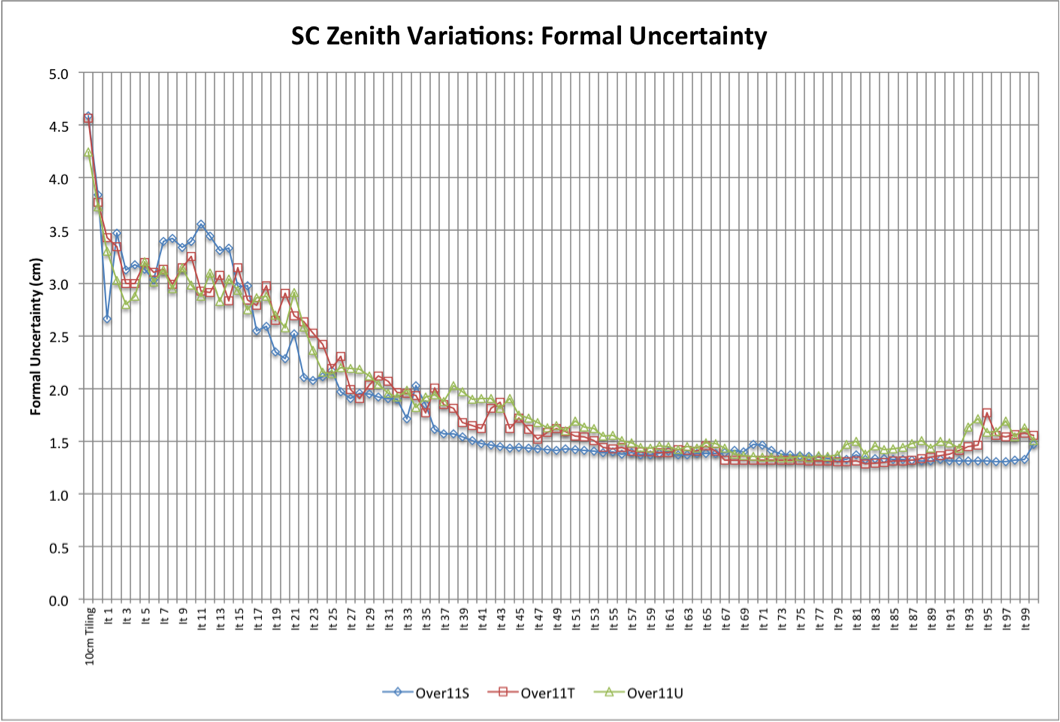
Figure 3: CompMapVec RMS
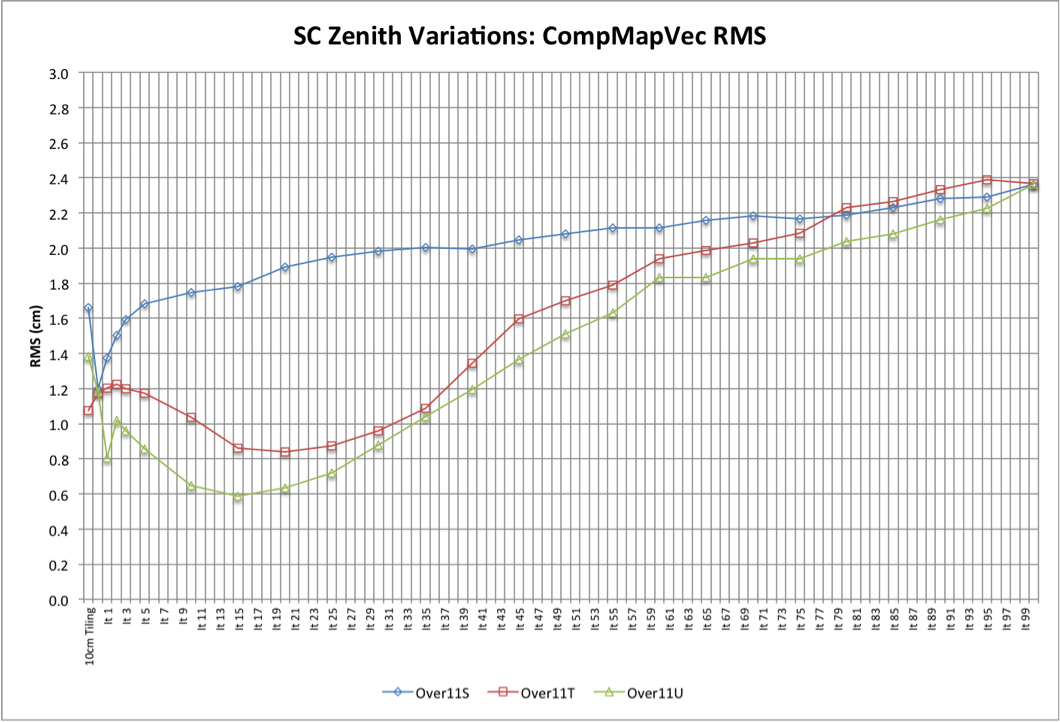
Figure 4: CompareOBJ RMS
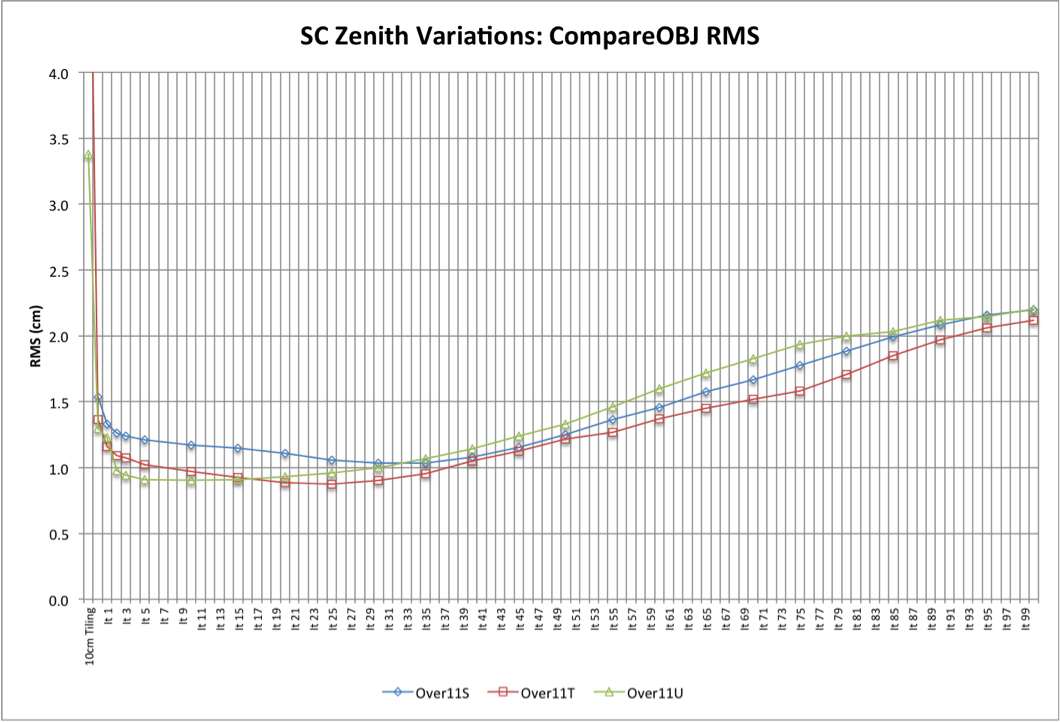
Figure 5: CompareOBJ With Opt Tran & Rot
Traces
Heat Plots
