|
Size: 517
Comment:
|
Size: 1351
Comment:
|
| Deletions are marked like this. | Additions are marked like this. |
| Line 6: | Line 6: |
| Notice that one of the s/c zenith angles is missing. For whatever reason that image didn't correlate well and was excluded from the solution. This did not happen on all landmarks in this test, but it did happen for more than half. |
|
| Line 10: | Line 12: |
| == Heat Maps == | Solution is surprisingly good given this is from a single sun angle (see Data Set above). However there are many details that SPC doesn't get right, such as an apparent oscillation away from the boulder, and a dip in the E-W transit on the right of the plot. The dip could be due an artifact from nearby topography, but it is not seen in the other Sun angle tests. Notice that the height of the boulder in this solution is always less than the truth, and the surrounding topography is often greater than the truth. == Heat Maps (x and y is in units of pixels, z is deviation from truth and has units of meters) == |
| Line 14: | Line 21: |
| Line 20: | Line 26: |
| Line 26: | Line 31: |
Data Set
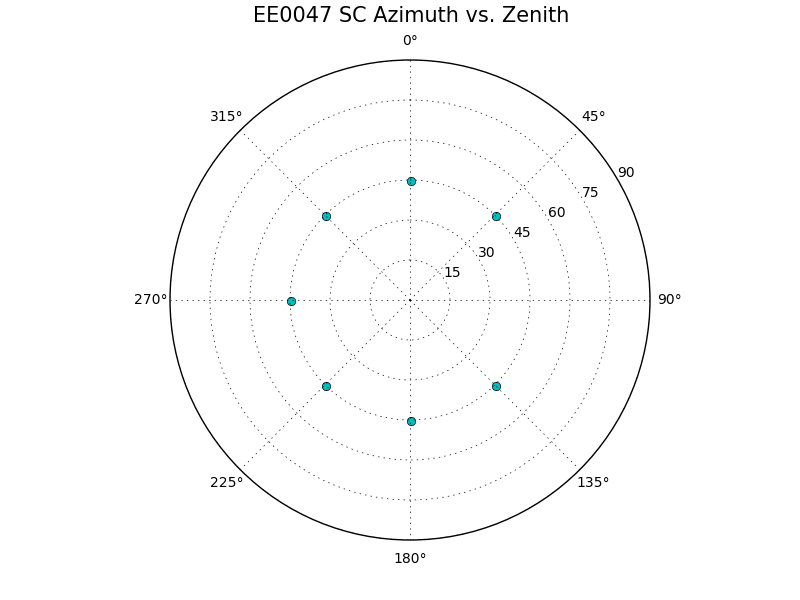
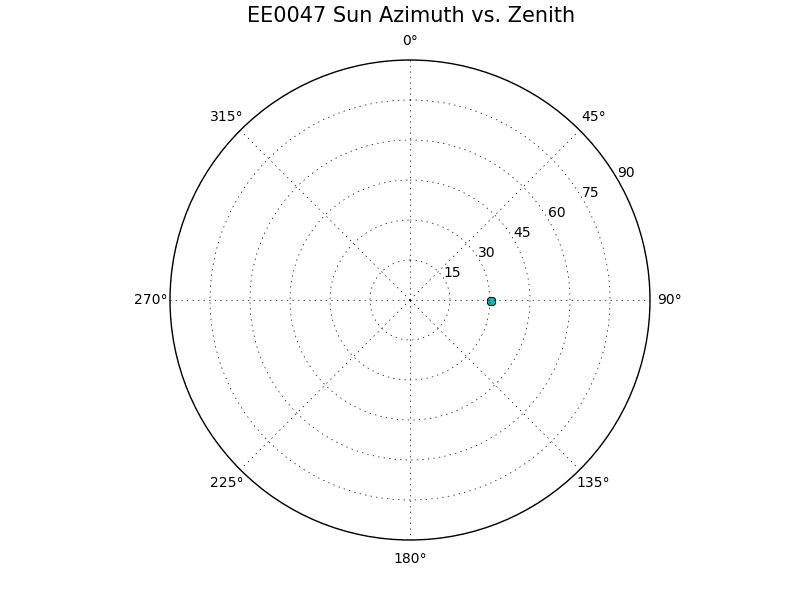
Notice that one of the s/c zenith angles is missing. For whatever reason that image didn't correlate well and was excluded from the solution. This did not happen on all landmarks in this test, but it did happen for more than half.
Transits
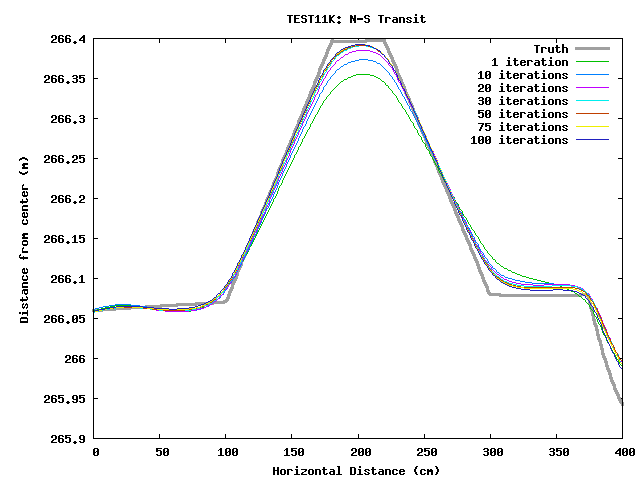
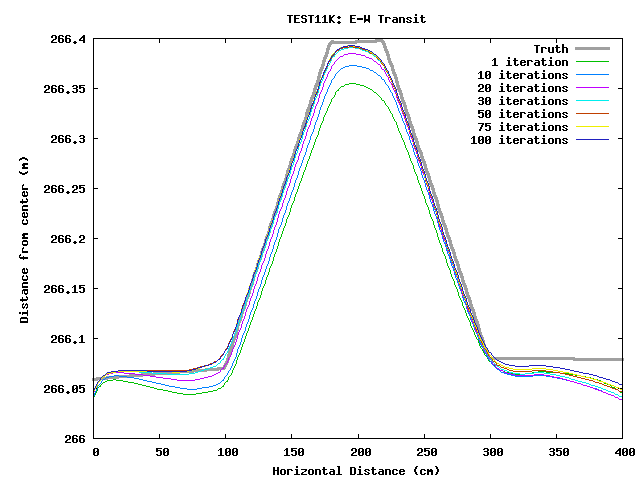
Solution is surprisingly good given this is from a single sun angle (see Data Set above). However there are many details that SPC doesn't get right, such as an apparent oscillation away from the boulder, and a dip in the E-W transit on the right of the plot. The dip could be due an artifact from nearby topography, but it is not seen in the other Sun angle tests.
Notice that the height of the boulder in this solution is always less than the truth, and the surrounding topography is often greater than the truth.
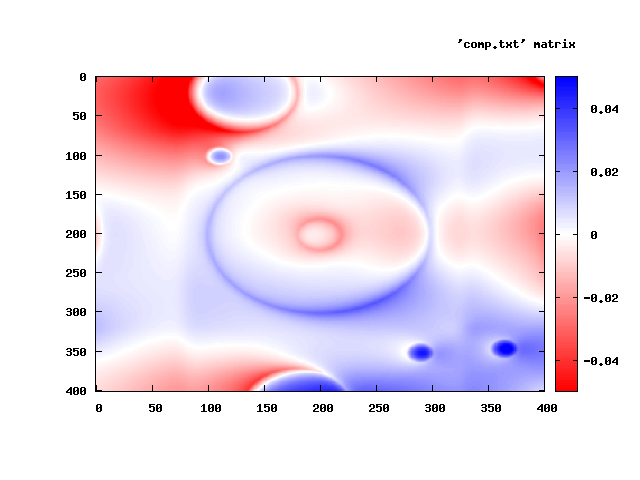
Heat Maps (x and y is in units of pixels, z is deviation from truth and has units of meters)
Iteration 1: 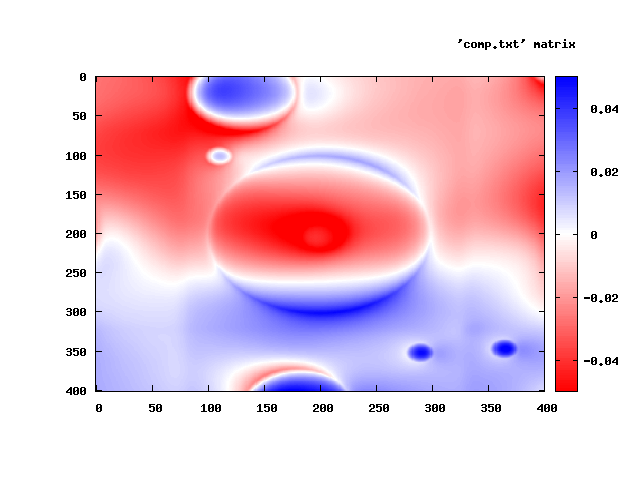 Iteration 10:
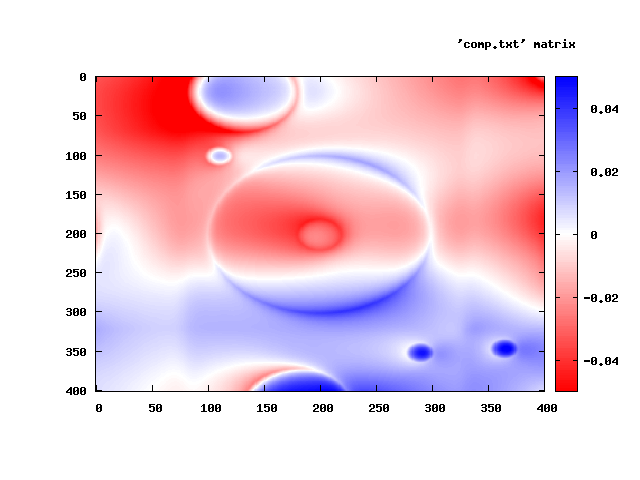
Iteration 20: 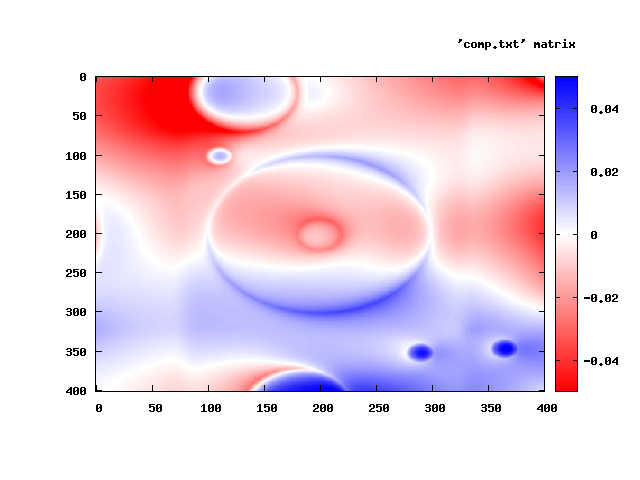 Iteration 30:
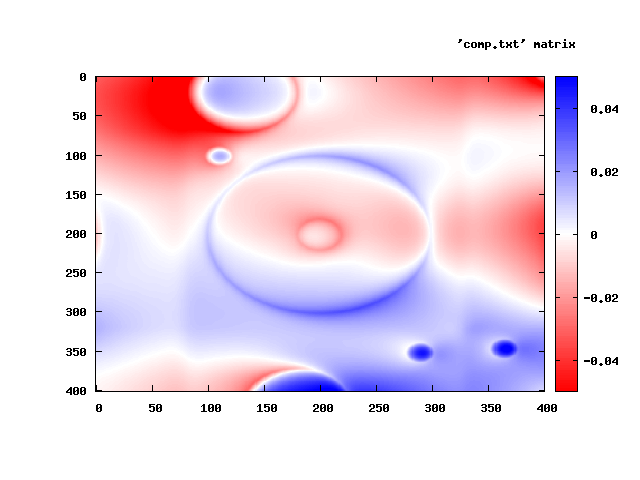
Iteration 50: 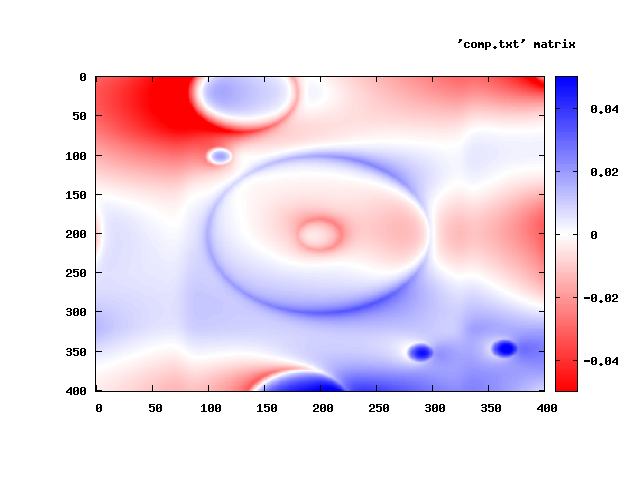 Iteration 75:
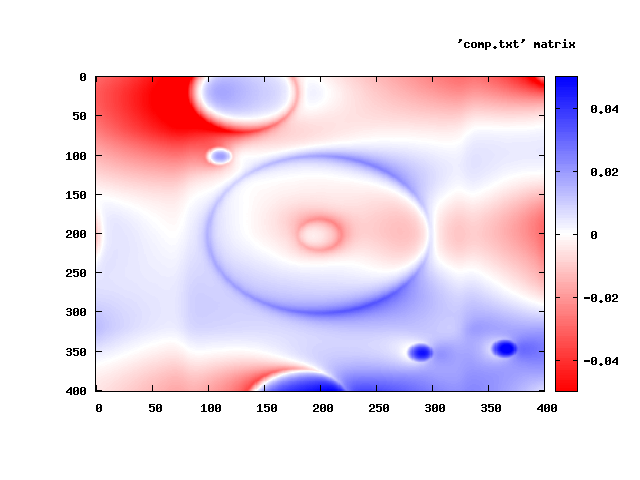
Iteration 100: 