Data Set
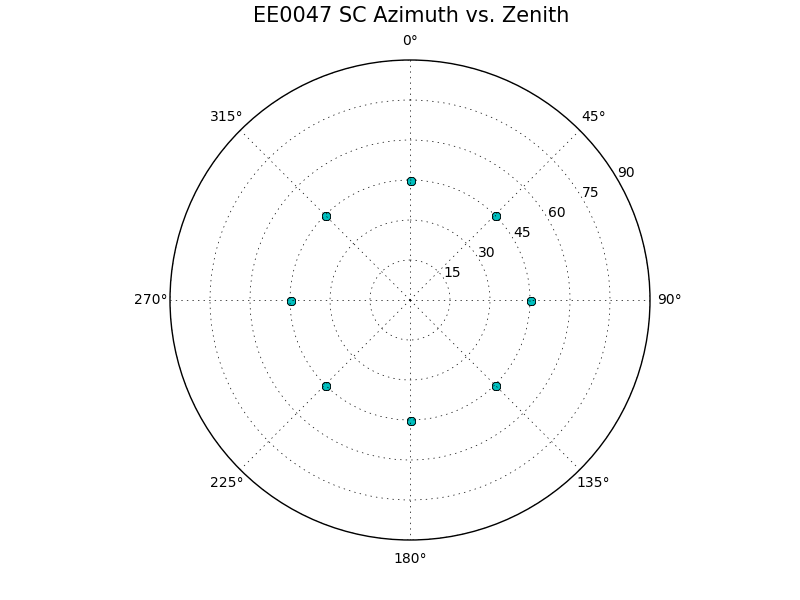
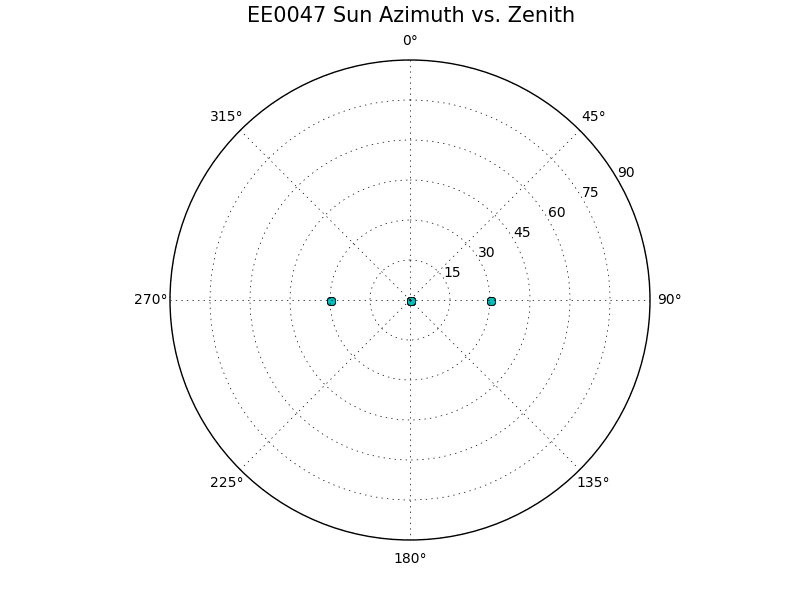
Transits
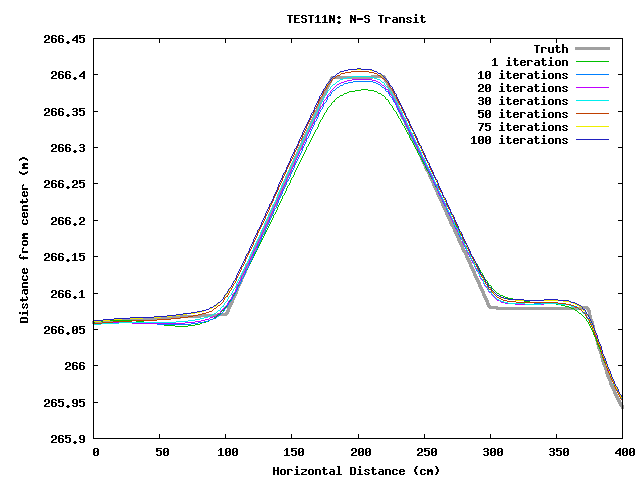
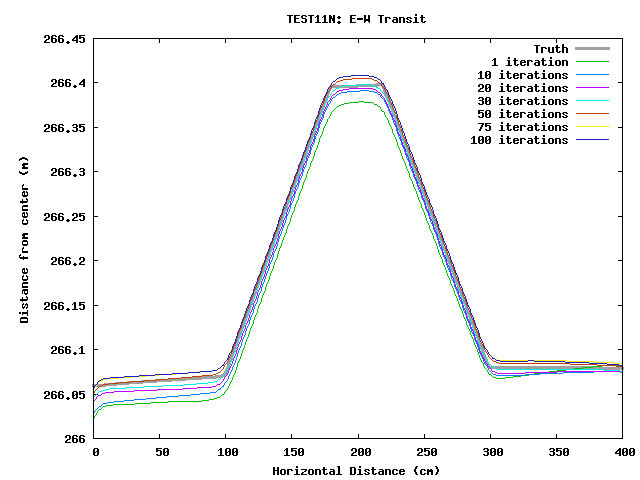
Later iterations get the sides of the boulder dead on, but the top of the boulder is then too high. N-S transit is pretty good, but there appears to be an E-W tilt.
Heat Maps (x and y is in units of pixels, z is deviation from truth and has units of meters)
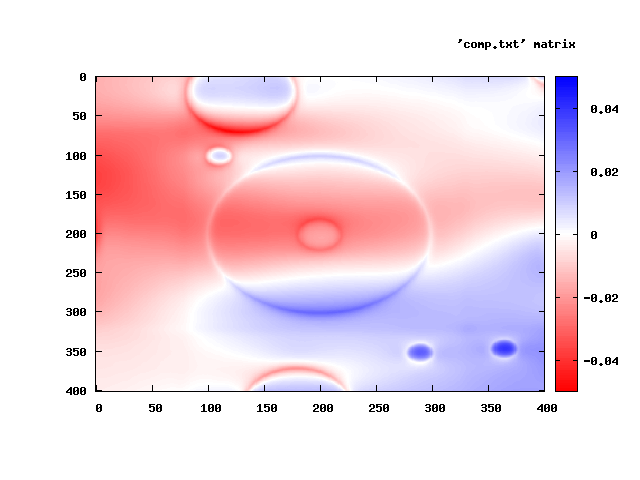
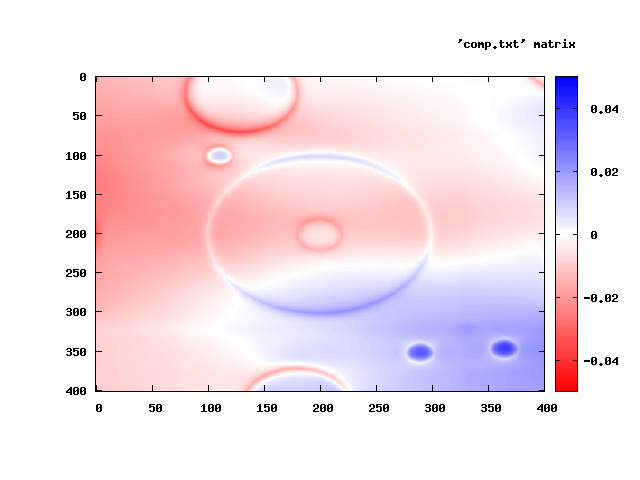
Iteration 1 and 10: The E-W tilt is more obvious in these heat maps.
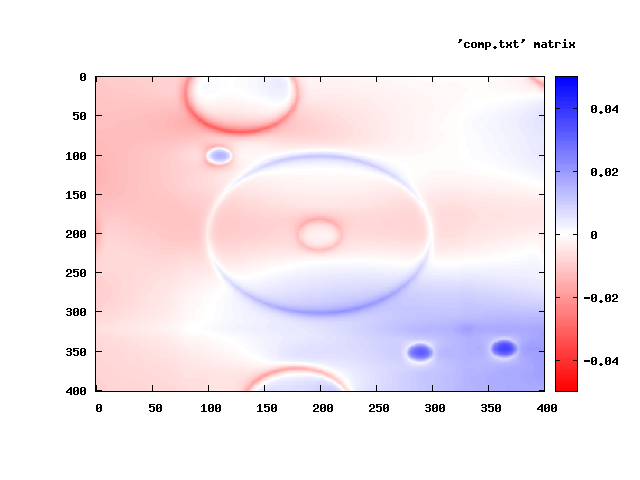
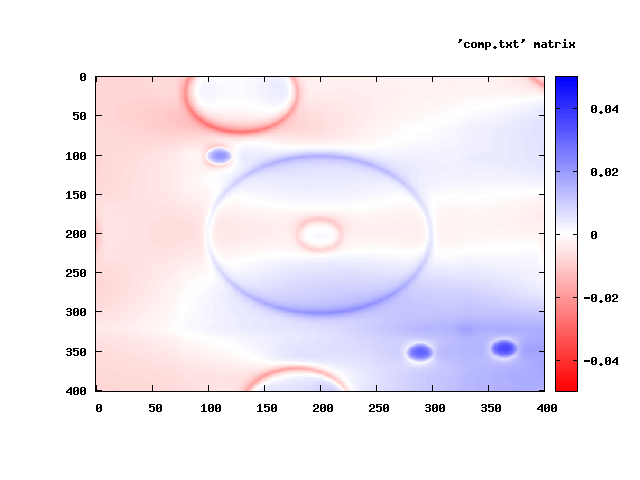
Iteration 20 and 30:
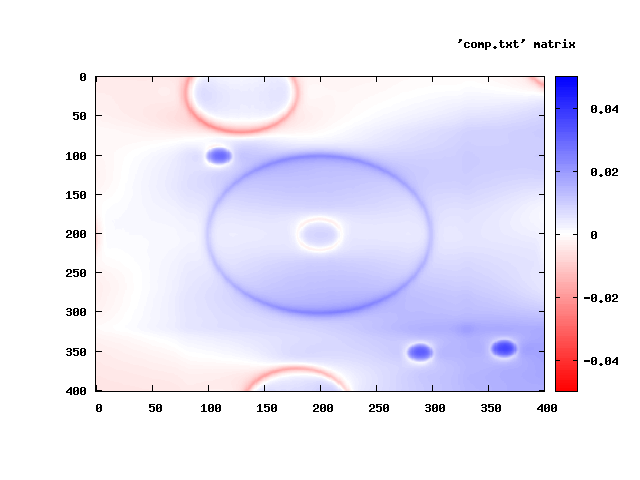
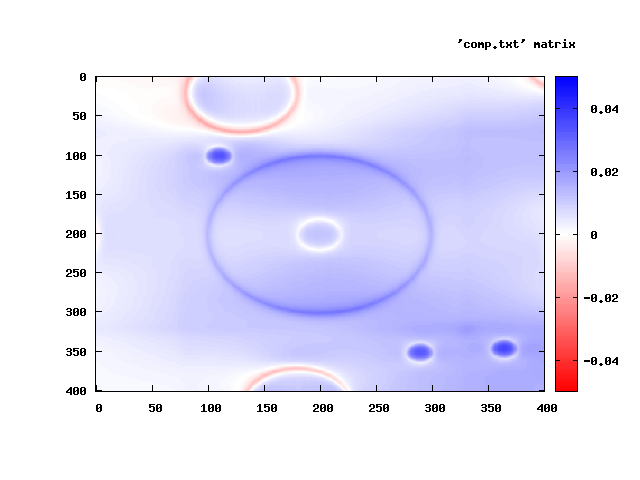
Iteration 50 and 75:
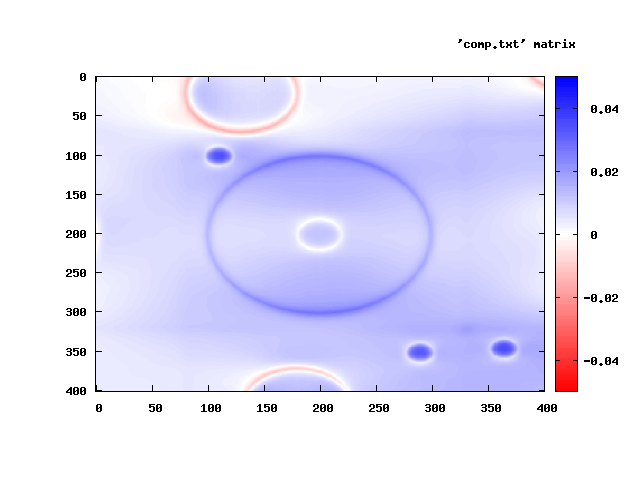
Iteration 100: The tilt is pretty well ironed out here, but now the topography is slightly too high.