Data Set
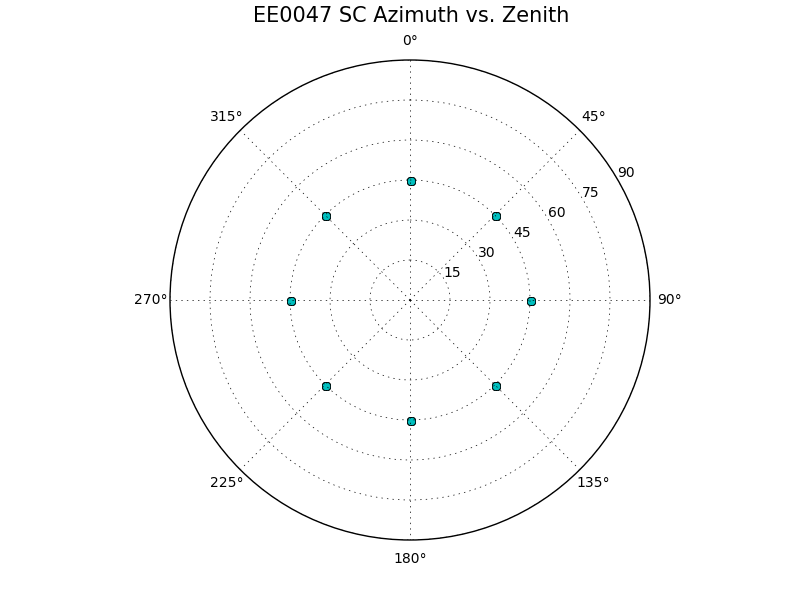
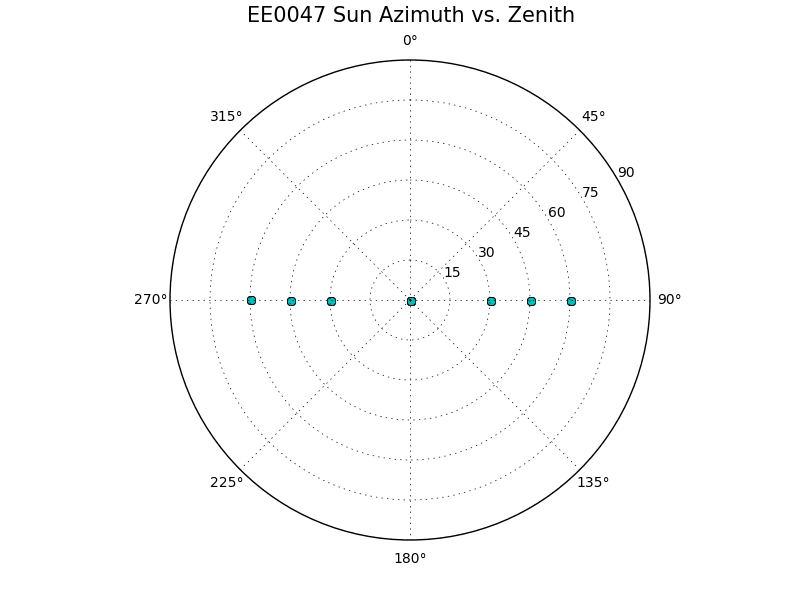
Transits
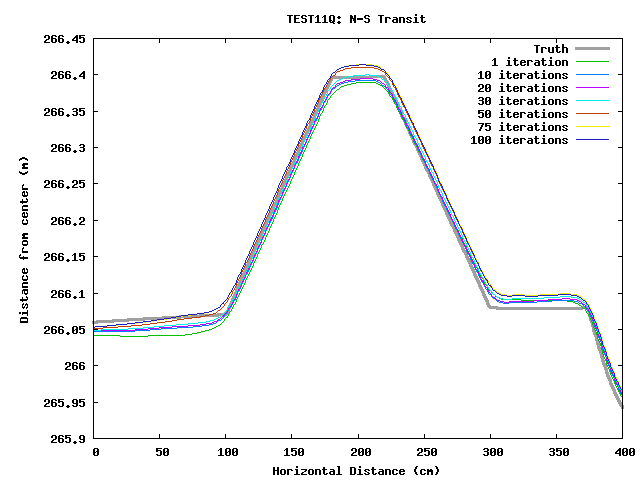
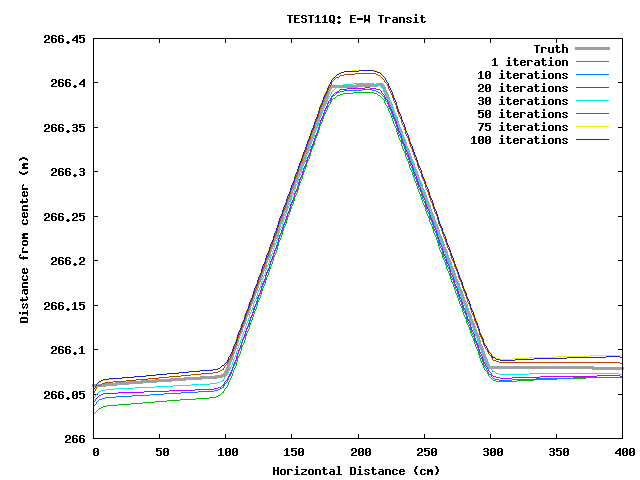
Much like the others, the boulder starts out too low and the ends too high. The surrounding topography has the same trend.
Heat Maps (x and y is in units of pixels, z is deviation from truth and has units of meters)
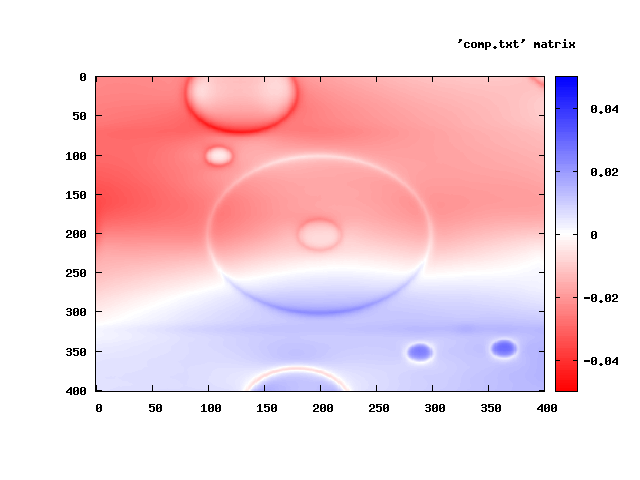
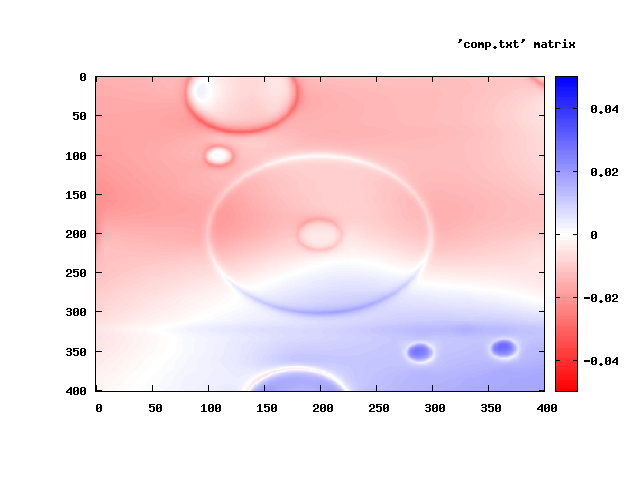
Iteration 1 and 10:
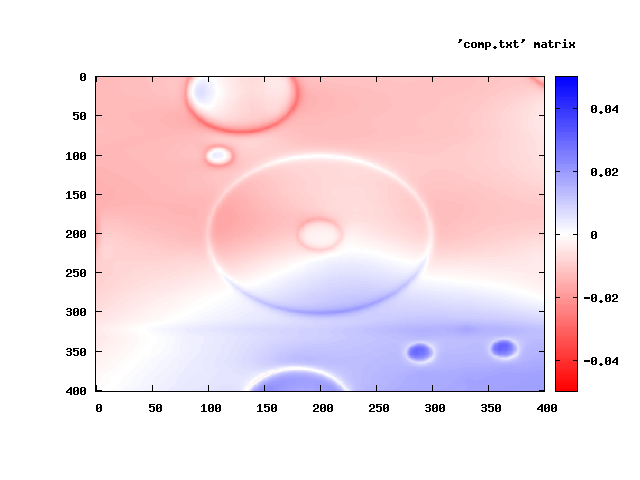
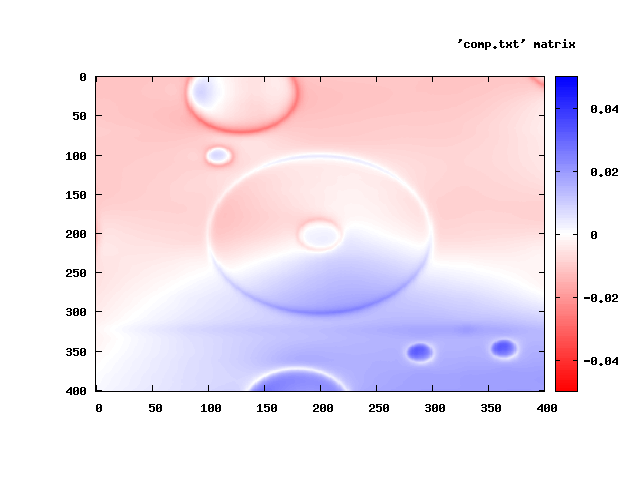
Iteration 20 and 30:
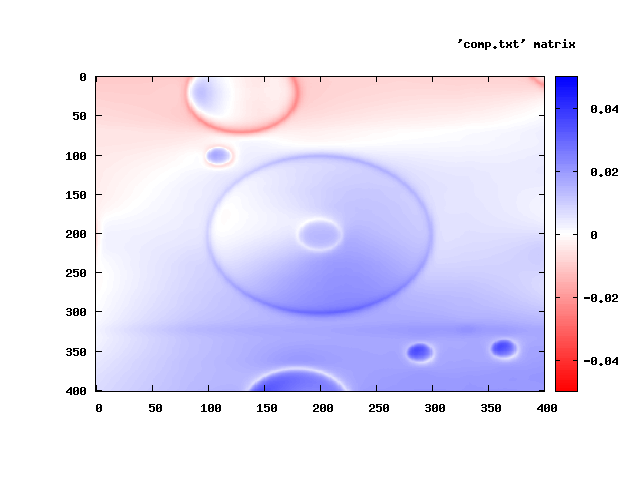
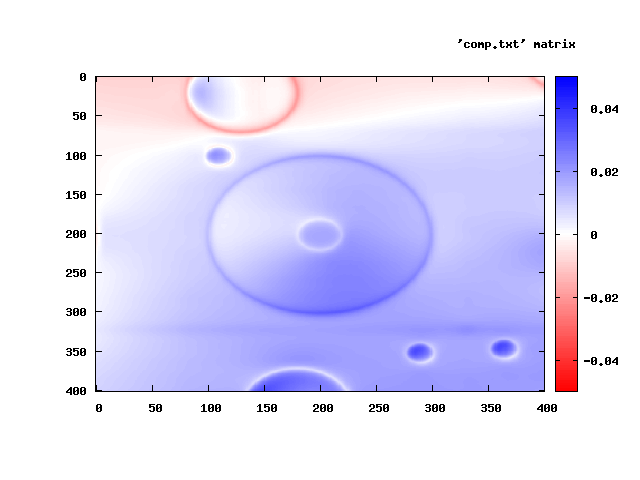
Iteration 50 and 75:
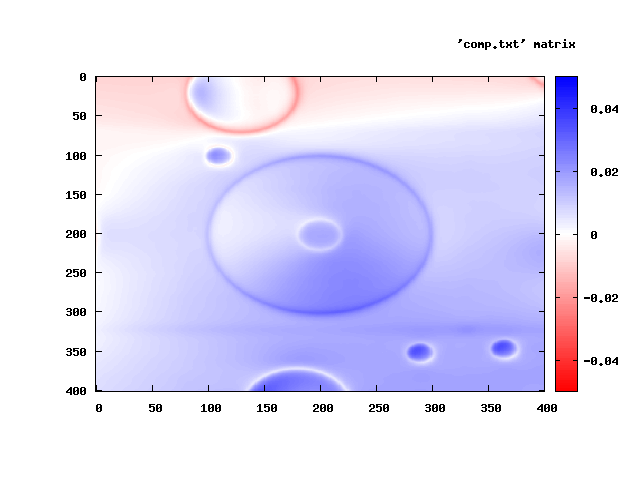
Iteration 100: