|
Size: 2769
Comment:
|
Size: 2868
Comment:
|
| Deletions are marked like this. | Additions are marked like this. |
| Line 27: | Line 27: |
| ||'''Processing Step'''||||||'''Correlation Score'''|| || ||'''F3F1 (Lommel-Seeliger without the 2)'''||'''F3F2 (Lommel-Seeliger with the 2)'''||'''F3F3 (Clark and Tikir)'''|| ||20cm Iteration 00|| ||10cm Iteration 00 (post Geometry)|| ||5cm Iteration 00 (post Geometry)|| ||5cm Iteration 10|| ||5cm Iteration 20|| |
|| ||||||'''Correlation Score'''|| ||'''Processing Step'''||'''F3F1 (Lommel-Seeliger without the 2)'''||'''F3F2 (Lommel-Seeliger with the 2)'''||'''F3F3 (Clark and Tikir)'''|| ||20cm Iteration 00||0.6141||0.6133||0.4572|| ||10cm Iteration 00 (post Geometry)||0.7143||0.7168||0.4506|| ||5cm Iteration 00 (post Geometry)||0.7679||0.7756|| || ||5cm Iteration 10||0.7839||0.7564|| ||5cm Iteration 20||0.7872||0.7884|| |
TestF3F Photometric Function Sensitivity Test Results
Definitions
CompareOBJ RMS: |
The root mean square of the distance from each bigmap pixel/line location to the nearest facet of the truth OBJ. |
Key Findings
Results and Discussion
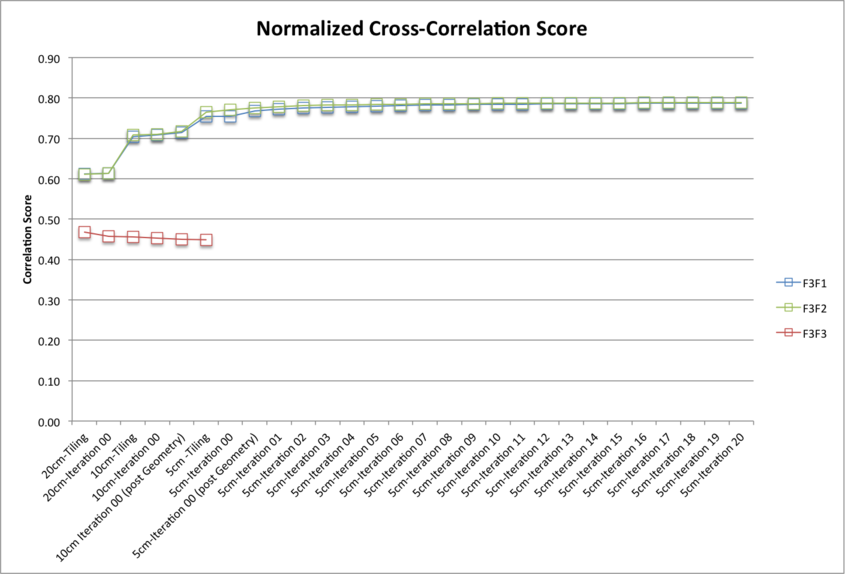
Results from testing the three photometric functions split into two groups characterized by differing digital terrain accuracy and model behavior. Sub-tests F3F1 and F3F2 (Lommel-Seeliger photometric function without the 2 and with the 2 respectively) performed well with minor differences in the measurements of accuracy, whereas sub-test F3F3 (Clark and Tikir photometric function) performed poorly with pervasive degradation of the digital terrain with every processing step conducted. A detailed analysis of the behavior of F3F3 is reported here: Test F3F3 - Analysis.
CompareOBJ RMS
Three CompareOBJ RMS values for the final 5cm resolution 20m x 20m evaluation bigmap are presented for each subtest and each S/C position and camera pointing uncertainty:
- The largest CompareOBJ RMS (approx. 65cm across subtests) is obtained by running CompareOBJ on the untranslated and unrotated evaluation model.
- The second smallest CompareOBJ RMS (approx. 15cm across subtests) is obtained by running CompareOBJ with its optimal translation and rotation option.
- The smallest CompareOBJ RMS (approx. 9cm across subtests) is obtained by manually translating the evaluation model and searching for a local CompareOBJ RMS minimum.
The CompareOBJ optimal translation routine is not optimized for the evaluation model scale (5cm pix/line resolution). Manual translations of the bigmap were therefore conducted in an attempt to find a minimum CompareOBJ RMS. The manually translated evaluation models gave the smallest CompareOBJ RMSs.
Normalized Cross Correlation Scores

F3F1 (Lommel-Seeliger without the 2) Correlation Scores:
|
Correlation Score |
||
Processing Step |
F3F1 (Lommel-Seeliger without the 2) |
F3F2 (Lommel-Seeliger with the 2) |
F3F3 (Clark and Tikir) |
20cm Iteration 00 |
0.6141 |
0.6133 |
0.4572 |
10cm Iteration 00 (post Geometry) |
0.7143 |
0.7168 |
0.4506 |
5cm Iteration 00 (post Geometry) |
0.7679 |
0.7756 |
|
5cm Iteration 10 |
0.7839 |
0.7564 |
|
5cm Iteration 20 |
0.7872 |
0.7884 |
|
The evaluation maps were compared with a truth map via a cross-correlation routine which derives a correlation score. As a guide the following scores show perfect and excellent correlations:
- A map cross-correlated with itself will give a correlation score of approx. 1.0;
- Different sized maps sampled from the same truth (for example a 1,100 x 1,100 5cm sample map and a 1,000 x 1,000 5cm sample map) give a correlation score of approx. 0.8.
