Find template
(lithos Main Menu Option 0. Find template)
Description
This Main Menu option builds a template that is used to further align images.
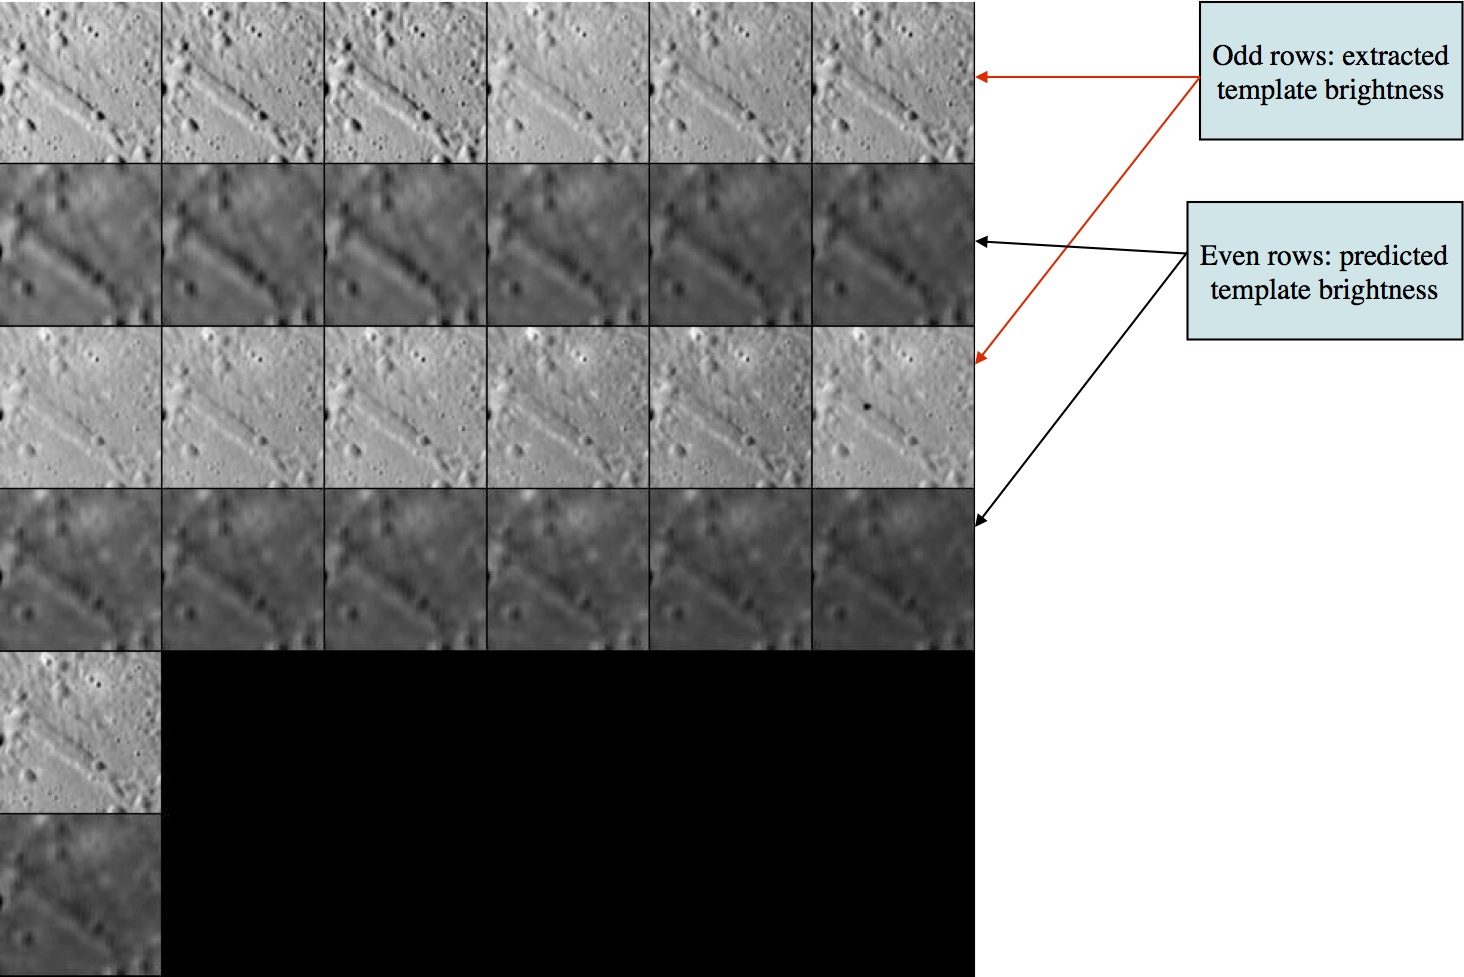
Here is a sample of a template. This example comes from LMRK_DISPLAY1.pgm.

Figure 00: LMRK_DISPLAY1 Option Used to Align Images
This is after 2 iterations. The predicted templates do not look as sharp because 2 iterations are not sufficient to solve well for the slopes and albedo.
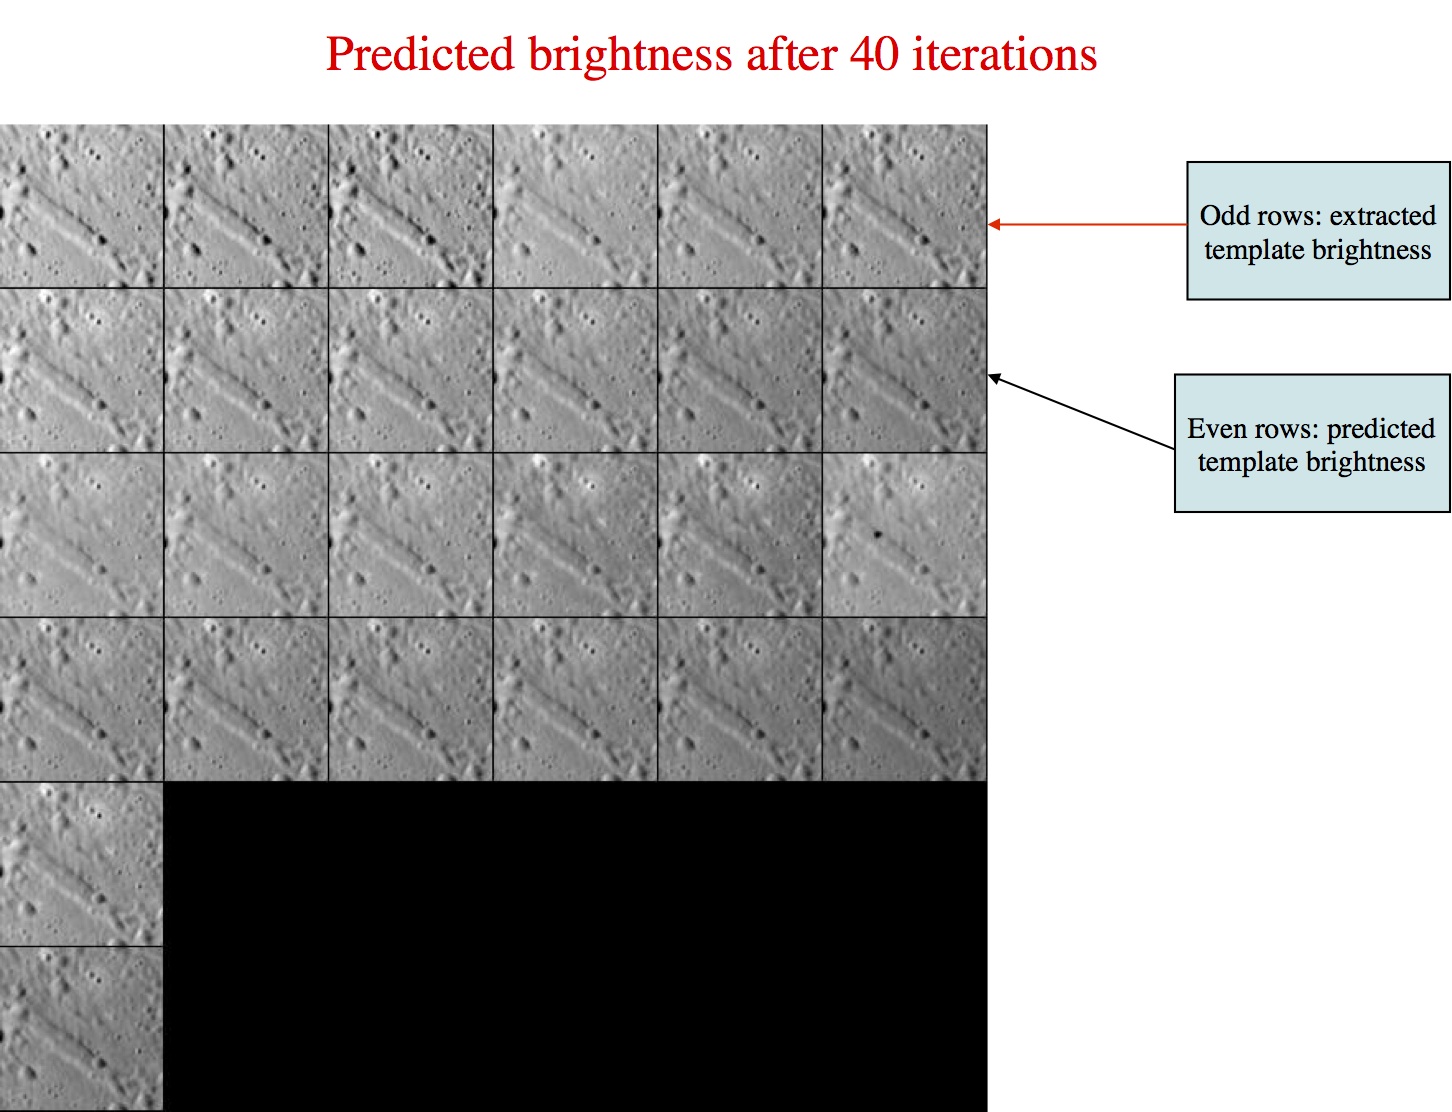
- The odd rows are referred to as "extracted templates" because they are derived from the spacecraft pictures, but have been modified (orthorectified plus other alterations).
- The even rows are referred to as "predicted templates" because they are derived from the maplet.
Many users refer to a "predicted template" as the "template", and the "extracted template" as "images." The template is the digital representation of the topography that is illuminated under the same conditions as the image immediately above the template found in each row.
SPC uses a template for aligning images using Align landmarks. It also adds image data to the template prior to building topography, which is also known as Find Heights). To do this
- Select images you want to work with. Frequently, all are on (i.e., used) by default.
- If you have a difficult image, you can toggle it off. For instance, if an image has a template that does not correlate well with the mean brightness template you can toggle it off so that during the current iteration run it does not contribute to the slope estimation.
Here is a sample display for Main Menu Option 0:
Main Menu: Q 0123O IUCRSG NVAMBX DEPL FZH? 0
 >0

EE0001
Lat =    -6.819
Lon =   264.131
Rad =     0.266

    k    chi    lambda   phi     res

    1   0.975   1.162   0.000   0.250
    2   0.962   1.138   0.000   0.250
   ...
   13   0.975   1.100   0.000   0.239
   14   0.000   1.348   0.000   0.239
Here is an explanation of the elements shown in the sample above:
EE0001 - Landmark name
Lat = -6.819 - Latitude
Lon = 264.131 - Longitude
Rad = 0.266 - Radius from center of figure
k - Image number
chi - Correlation statistic for initial observed brightness versus predicted brightness
CHI0 - Correlation limit, defaults to 0.5, unless it's set in INIT_LITHOS.TXT The predicted brightness for a pixel in a maplet is given by
- B = LAMBDA*ETA*ILLUM(COS(I),COS(E),PHASE)+PHI
- where
- B = LAMBDA*ETA*ILLUM(COS(I),COS(E),PHASE)+PHI
LAMBDA - Constant that serves to relate the topography manifested by the slopes leading to variations in I and E to the brightness measured by the imaging data.
- ETA - relative albedo, normalized to 1 across the maplet I - incidence angle E - emission angle
PHI - Constant background in the brightness such as was observed due to atmospheric scattering in Viking Orbiter images of Mars. The PHI term is usually ignored by setting the parameter CHI0 = 1 in INIT_LITHOS.TXT. (If CHI < CHI0 then PHI = 0.)
res - The ratio of image resolution to maplet resolution (i.e., GSD). Larger numbers mean the image has a lower resolution than the maplet. Typically, we don't use pictures with res much greater than 4.
Suboptions
Main Menu Option 0. Find template has these suboptions:
 Picture to toggle
 a use all
 b use registered
 c use correlated
 0 end/continue
 q Quit
a use all - Includes all of the images in the calculation of the template (i.e., it removes the * from all images).
b use registered - Typically not used. This option puts a "*" on any image that has not been added to a landmark. It assumes that such images have not yet been registered.
c use correlated - Prompts you to enter a number between 0-1. It then compares the number you entered with the correlations from the last alignment performed. It excludes images below the entered value. This will be noted by putting a "*" after the "res" column for each image that has been toggled off.
0 end/continue - Begins template iterations.
- You will then be prompted to:
Enter number of iterations - Enter in the number of iterations to perform when building the template.
- Usually enter '40', after which you will see a display like this:.
 Enter number of iterations
40
 rms brightness residual =     9.30908314089276545E-003
 rms brightness residual =     9.27805039374508290E-003
...
 rms brightness residual =     8.68283596819066118E-003
 rms brightness residual =     8.67799102637487052E-003

 slope sigma =   5.30813855279686289E-002

  -0.03482   0.11297  -0.03439   0.00162  -0.04342   0.04161

 gc tmpl.pgm
- After the iterations are finished, you will return to the Main Menu.
q Quit - go back to the Main Menu
Hidden Suboptions
The following suboptions are available but are not shown in the list:
# Image number - Instead of entering 'a', 'b', or 'c', you can enter the image number.
- For example: '2', then "Enter" If you enter an image number, the program will toggle the "selected" flag (*).
#, # - Similar to above, but indicates a range of images. If you enter a range of images, the program will toggle the "selected" flag (*) for all images within that range.
Using Option 0. Find Template
You will often start with some initial topography that you can align from, as shown here:
 The pictures in these samples do not exactly match the text because they came from different landmarks.

Figure 00: Example of Landmarks That Can be Used for Initial Manual Alignment
- Typically, you do an alignment to make sure the images are correctly aligned. If they are not, you'll want to exclude them from the "Find template" calculation.
- Most of the time it will be an auto-align. If an image does not correlate well or it shows a predicted landmark location that cannot be auto-aligned it may have the be a manual alignment
The display output from an auto-align looks like this:
 enter spacing
 1
   1   P3T11M2H0217        0.009    -0.040     0.340 +
   2   P3T11M2H0218       -0.004    -0.074     0.398 +
   3   P3T11M2H0219       -0.074    -0.020     0.290 +
   4   P3T11M2H0220       -0.002    -0.173     0.366 +
   5   P3T11M2H0221        0.060     0.000     0.609 +++
   6   P3T11M2H0222        0.036    -0.003     0.600 +++
   7   P3T11M2H0223        0.029     0.005     0.489 ++
   8   P3T11M2H0224        0.037     0.011     0.593 +++
   9   P3T11M2H0225       -0.016     0.018     0.473 ++
  10   P3T11M2H0226       -0.020     0.020     0.379 +
  11   P3T11M2H0229       -0.003     0.010     0.658 +++
  12   P3T11M2H0230       -0.013     0.008     0.678 +++
  13   P3T11M2H0231       -0.001    -0.029     0.534 ++
  14   P3T11M2H0232        0.000    -0.038     0.542 ++
0.031 0.049- From the Main Menu, enter in '0', 'c', '0.5'. This will toggle off all images that had a correlation below 0.5, then bring you back to the Main Menu. To see the result of toggling off those images, you'll have to go back into the "Find template" menu.
- Enter 0 again. The display output looks like this:
    k    chi    lambda   phi     res

    1   0.000   1.983   0.000   1.288
    2   0.000   1.383   0.000   1.288
    3   0.000   1.405   0.000   1.276
    4   0.000   1.666   0.000   1.174
    5   0.000   1.993   0.000   1.174
    6   0.000   1.679   0.000   1.183
    7   0.000   1.616   0.000   1.183
    8   0.000   1.714   0.000   1.219     *
    9   0.000   1.452   0.000   1.219     *
   10   0.000   1.781   0.000   1.263     *
   11   0.000   1.394   0.000   1.263     *
   12   0.000   1.821   0.000   1.276     *
   13   0.000   1.732   0.000   1.237     *
   14   0.000   1.469   0.000   1.237     *
There were 7 images from the auto-align that had a correlation below 0.5. Now 7 images have a * by them. Also note that lithos has moved the images with a correlation below 0.5 to the bottom of the list. In other words, those image values have changed.
- For typical iterations, use 0, 0, 40.
- The text output will look similar to the sample above from "0 end/continue"
At this point, LMRK_DISPLAY1.pgm looks like the following. Notice that the image is not only brighter, but a bit sharper as well.

Figure 00: LMRK_DISPLAY1 Output for Well Aligned Images
Additional Reference
From LITHOS.f
This process solves for the slope and albedo distribution for a landmark template by minimizing the brightness residuals between the predicted and observed image data. It first uses the subroutine FIND_LAMBDA to determine an overall constant brightness scale (lambda) for each image as well as a possible background (phi). The background is set to zero if the correlation chi between initial observation and prediction is less than some preset value (chi0) whose default value is 0.5. In practice, we usually dispense with phi altogether by setting CHI0=1 in INIT_LITHOS.TXT, so lambda is the only parameter that matters. Look at the abstract in FIND_LAMBDA_PIC for more details.
The process produces a table with entries:
- k chi lambda phi res pflag
The column label k is the number of the image as it appears in the landmark display and res is the ratio of the image resolution ot the landmark scale. The last column, pflag, is empty if the image data is to be used in the slope/albedo determination and * if it is not.
(Compiled by JRW)