Reference Peak
Local Tilt Investigation
Aims and Objectives
Purpose of test: To investigate the magnitude and mechanism of local tilting of the DTM in the region of the reference peak.
Additional Objectives:
- Investigate the effect of the order in which overlap corrections are applied to maplets;
- Consider the vertical-error introduced by local tilt;
- Calculate the relative magnitudes of tilt and induced vertical error with image resolution and maplet ground sample distance;
- Study a larger evaluation area centered on the peak and containing multiple peak and crater features;
- Compare tilt behavior across tests, comparing results for test Over11I against Over11S, T and U, the spacecraft zenith variation test suite.
Background
A local tilt in the region of the reference peak is apparent upon inspection of the DTM, specifically the 4mx4m bigmap which is centered on the peak. Furthermore, tilt of bigmaps with respect to truth models has been observed across tests. The purpose of this investigation is to measure the magnitude and direction of tilt through tiling and iterating steps and to explore the mechanism by which the DTM tilts with respect to the truth model.
A possible source of systematic error and tilt is the procedure for updating the solution of a single maplet by considering the local solutions of all overlapping maplets and applying an 'overlap correction'. The standard procedure for tiling bigmaps and iterating maplets with regards to overlaps is as follows.
Tiling a bigmap:
- The region in which the bigmap is contained is tiled with a suite of new maplets which will have a ground sample distance greater than the ground sample distance of the existing maplets contained in the bigmap area.
- Center coordinates for the new maplets are generated based on the maplet ground sample distance, the Q size, and the overlap percentage.
- Starting from the North-West-most maplet center coordinate, the first new maplet is created.
- Images are added, eliminated and registered for the new maplet. The photoclinometric solution is generated, conditioned using differential stereo and used to update the topographic model. A stereogrammetric correction is then applied causing adjustment to heights and location of the maplet. The overlap correction is then generated by considering the existing local height and slope data of all overlapping maplets. During tiling, the overlapping maplets are the pre-existing higher ground sample distance maplets.
- The maplet center coordinate immediately to the East of the first new maplet is then used to create the next new maplet.
- Again, images are added, eliminated and registered, the photoclinometric solution is generated and conditioned using differential stereo, a stereogrammetric correction is applied, then, the overlap correction is applied. Now the overlapping maplets will include the first new maplet, which overlaps only along one edge of the new maplet.
- This procedure continues until the Northernmost row of new maplets have been created, solved and overlap corrected.
- The process is then repeated to create the row of maplets immediately South of the Northernmost row of new maplets.
- Tiling is complete when the South-Eastern-most new maplet has been generated.
- As new maplets are created, their names are appended to USED_MAPS.TXT.
Iterating the maplets contained in a bigmap:
- The maplets are processed in the order in which they appear in USED_MAPS.TXT, i.e. the order in which they were created. Thus each GSD suite of maplets is iterated in turn, starting from the highest Ground Sample Distance suite (lowest resolution) and ending with the lowest GSD maplet (highest resolution). The maplets in each GSD suite are iterated from the North-Western-most maplet to the South-Eastern-most maplet in rows traveling West to East.
- For each maplet, the images are registered, the photoclinometric solution is generated, conditioned using differential stereo and used to update the topographic model. The overlap correction is then generated by considering the existing local height and slope data of all overlapping maplets. During iterating, the overlapping maplets will include iterated higher GSD (lower resolution) maplets, the not-yet-iterated lower GSD maplets, iterated same-GSD maplets to the North and West of the maplet, and not-yet-iterated same-GSD maplets to the East and South of the maplet.
This study therefore intends to investigate the contribution of the order in which overlap corrections are applied to the tilt local to the reference peak, calculate the magnitude and direction of tilt at various tiling GSD steps, calculate the vertical error introduced by tilt and observe systematic error in a larger area around the reference peak.
Methodology
Test Over11I was chosen for the investigation since it has been the focus of user-to-user and server-to-server repeats and has a low number of images, enabling relative speed in processing.
The following tests were conducted:
Baseline: Test Over11I tiled at GSD of 10cm and 5cm. Iterated 100 times at GSD of 5cm.
Repeat: A same-user, same-server, equal-numnber-of-core-processors repeat of the baseline test Over11I was conducted to obtain a measure of uncertainty.
Backwards Tiling/Iterating: The baseline test was re-run with the only difference being the order in which maplets were tiled and iterated. The standard order was reversed; maplets were processed starting with the South-East-most maplets, traveling East to West along each row, finishing with the North-West-most maplet. (There was no change in the order in which GSD maplet suites were processed; as per standard processing, maplet suites were processed starting with the highest GSD (lowest resolution) maplets and finishing with the lowest GSD (highest resolution) maplets.
Higher Resolution Tiling: The Baseline and Backwards Tiling/Iterating Tests were tiled at lower GSDs, starting from the last tiling step, thus their processing steps were: Tiled at 10cm, 5cm, 2cm, 1cm with no iterations.


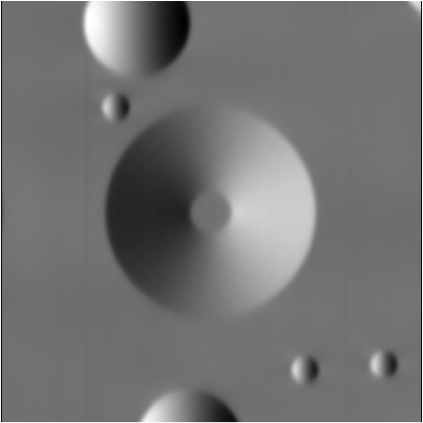
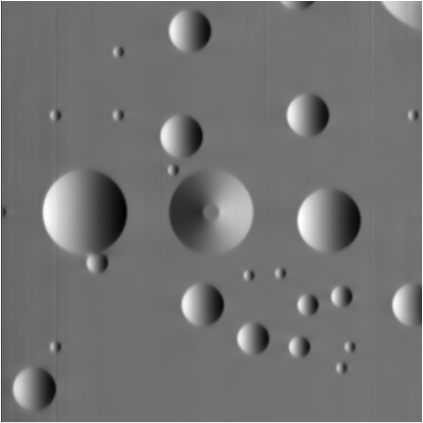
Images, from left to right, 4m x 4m bigmap centered on the reference peak, and 10m x 10m bigmap centered on the reference peak.
Two evaluation areas were used to obtain CompMapVec heat plots, central transits and statistics, as illustrated above. The 4m x 4m evaluation area is consistent with the full suite of Over11I test evaluations. An additional 10m x 10m area centered on the reference peak was evaluated in order to consider systematic errors, tilt and relative statistics for a larger landscape around the reference peak which contains multiple peak and crater features. As per the Over11 test suite, the evaluation area ground sample distance was 1cm across tests.

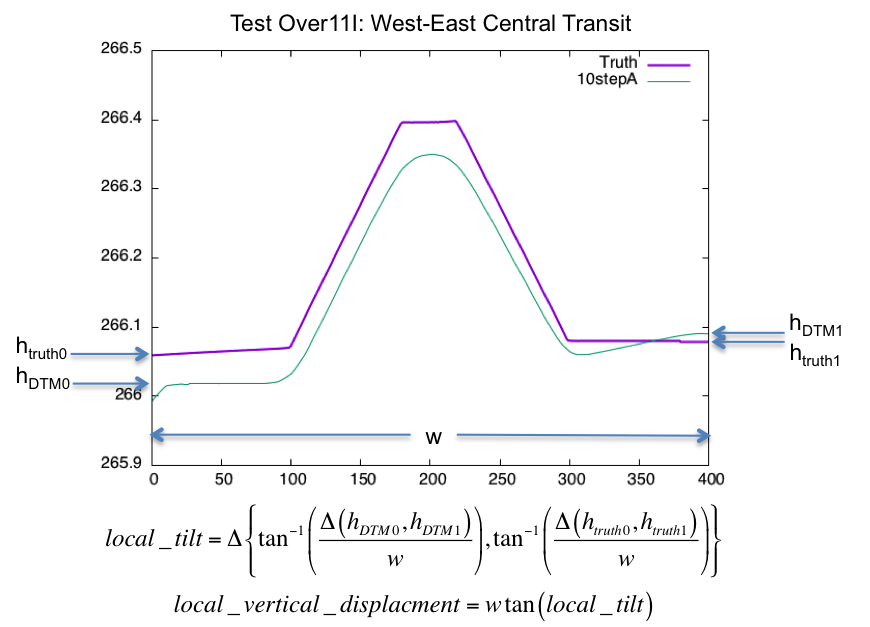
The magnitude of local tilt was calculated from the heights at the edges of the 4m x 4m bigmap and truth model central transits running due North and due East. Local tilt therefore refers to the tilt of the underlying DTM landscape with respect to the truth landscape extending only 2m from the center of the reference peak.
The local tilt induced vertical error was calculated by obtaining the vertical displacement due to tilt across 4m.
Results and Discussion
Repeatability
The results of the repeatability test are stored here: Local Tilt Repeatability Results
The Over11I baseline and repeat test demonstrate high repeatability:
CompMapVec, Compare OBJ and Compare OBJ with Optimal Translation and Rotation RMSs repeat within 2% for tiling steps and early iterations, and repeat within 7% beyond 10 iterations;
- Formal Uncertainties repeat within 1% for tiling steps, but demonstrate a much higher variability through iterations with repeats falling within 30%;
- Baseline and repeat heat plots and central transits are indistinguishable from one another.
The differences in formal uncertainty, RMSs and tilt reported herein are therefore due entirely to the order in which the maplets are processed and overlap corrections applied.
Dynamic Tilt Behavior
To view animations illustrating the dynamic tilting over tiling and iteration steps, please follow the links:
Local Tilt Heat Plot Animations
Local Tilt Central Transit Animations
The static images are stored here:
The dynamic tilt behavior is different depending on the order by which the maplets have been processed and overlap corrections applied.
For both the standard ('forwards') and the 'backwards' tiled/iterated tests, 10cm tiling results in a significant tilt across the 10m evaluation area which decreases with lower GSD tiling and iteration, although the entire DTM surface drifts vertically, away from the truth.
Interestingly the direction of tilt across the standard (forward) and backward tiling/iteration tests is broadly similar West to East but not consistent North to South, but not opposite in direction as would perhaps be expected given the reversed order of processing maplets and applying overlap corrections.
In terms of the central transits, the West-East central transits for standard (forward) and backward tiling/iteration are not dissimilar, with differences in tilt magnitude after the 10cm and 5 cm tiling diminishing through iteration to reach near-conformity by 50 iterations. The North-South transits however remain dissimilar in tilt magnitude and direction throughout the 10cm and 5cm tiling and iteration steps.
Tilt is no longer visible for the 2cm and 1 cm tilings and the standard (forward) and backward tiling/iteration tests start to conform.
Dynamic tilt behavior is also recognizably similar across tests Over11I, S, T and U, which differ only in number of images and the viewing conditions.
Magnitude of Tilt and Scalability with DTM Ground Sample Distance
The results of the tilt magnitude and vertical displacement calculations are stored here: Local Tilt Magnitude Results
Stats: Forward (Standard) vs Backward Tiling and Iterating
Link to charts: Local Tilt Stats
Discussion.
10m Site Stats
Link to charts:
Link to charts: 10m TAG vs 4m Peak Stats
Compare statistics between the 4m peak site and the 10m site, centered on the peak.
Conclusions and Recommendations
How feature-based is the tilt magnitude?
