Test 11: ReferencePeaks
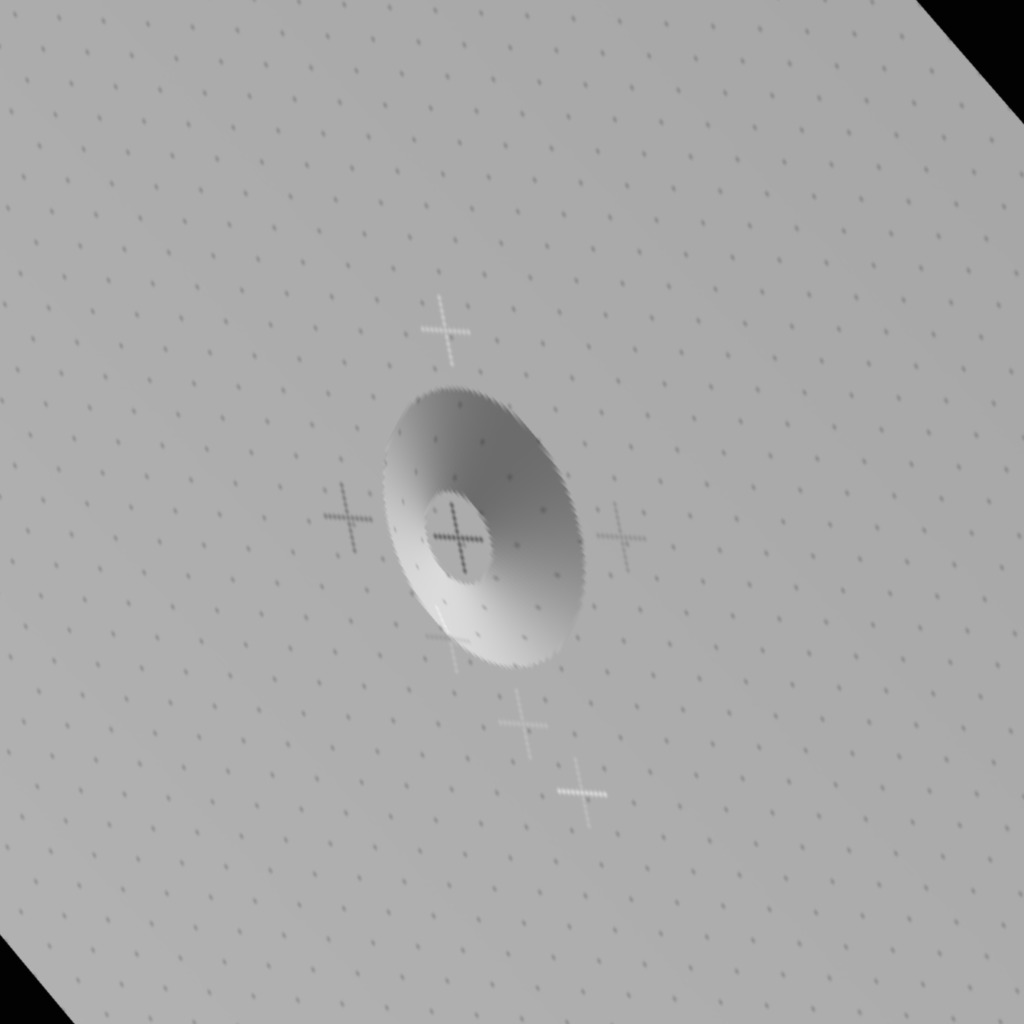
Take PIT020 as the only maplet in MAPLIST.TXT. Generate 5cm images of the topography (which is based at TAG Site 1). Then we build a MAPLET, saving the MAPLETs flatMapVect at several states.
Simple Variations
Groups of images - (adjusted for 5cm)
- Test11A - Detailed Survey. Eric (Has 11 images, very low in sample space)
- Test11B - Min Orbit B (by hand, calculate the minimum requirement)
- Test11C - Average Orbit B (use a random Orbit B solution with 3 unique observation/illumination conditions)
- Test11D - Best Orbit B (as we did before)
- Test11E - Optimum Collection (as we did before)
Name |
Sun Az |
Sun Zenith |
S/C Az |
S/C Zenith |
Optimum Collection1 |
0, 90, 180, 270 |
45 |
every 20 |
45 |
Optimum Collection2 |
135 |
30 |
every 20 |
45 |
- Test11U - Criss Cross (combine both of these sets)
Name |
Sun |
S/C Az |
S/C Zenith |
Criss Cross 1 |
80, 60, 40, 20, 0, -20, -40, -60, -80 |
45 |
45 |
Criss Cross 2 |
45 |
0, 180 |
80, 60, 40, 20, 0 |
Variations
Spacecraft Azimuth Variations
Name |
Sun |
S/C Az |
S/C Zenith |
|
Test11F |
45, 0, -45 |
every 20 |
45 |
Eric |
Test11G |
45, 0, -45 |
every 30 |
45 |
Diane |
Test11H |
45, 0, -45 |
every 45 |
45 |
Tanner |
Test11I |
45, 0, -45 |
every 60 |
45 |
Kris |
Test11J |
45, 0, -45 |
every 90 |
45 |
Sun Variations
Name |
Sun |
S/C Az |
S/C Zenith |
Test11K |
30 |
every 45 |
45 |
Test11L |
30 -30 |
every 45 |
45 |
Test11M |
-45, -45 |
every 45 |
45 |
Test11N |
30, 0, -30 |
every 45 |
45 |
Test11P |
45, 30, 0, -30, -45 |
every 45 |
45 |
Test11Q |
60, 45, 30, 0, -30, -45, -60 |
every 45 |
45 |
Test11R |
60, 30, -30, -60 |
every 45 |
45 |
Spacecraft Zenith Variations
Name |
Sun |
S/C Az |
S/C Zenith |
Test11S |
45, 0, -45 |
every 45 |
0, 30, 60 |
Test11T |
45, 0, -45 |
every 45 |
0, 20, 40, 60, 80 |
Test11U |
45, 0, -45 |
every 45 |
0, 14, 30, 45, 60, 75 |
Hill Data
I have created the following hills for testing
- PIT007 - 7 deg tilt
- PIT014 - 14 deg tilt
PIT020 - 20 deg tilt <-- Let's use this one
- PIT030 - 30 deg tilt
- PIT045 - 45 deg tilt
- PIT060 - 60 deg tilt
Truth Maplets
- -8.027 262.768
- T11TRU.MAP - already built. It has the truth heights loaded from PIT020.
- T11TRU.TXT -- Text file of the maplet. Use for plotting transits
- t11-truth.obj -- OBJ file for testing using CompareOBJ
Testing Maplets
- -8.027 262.768
- Build a model MAPLET using TAG Site 1 center position (5cm resolution and Q=49). Do not load a base map for topography
- Create MOD20#, which # is the test number (letter)
- Align the images with the key location at 50/50.
- Build template with 100
- (Skip until close to perfect) -- Do an auto align
- Build height using the iteration template
- Do flatMapVec and rename it to mod-20#-1
- Do compMapVec between MOD20# and T11TRU
- Repeat as necessary
Iteration Template
0
0
44
2
8                fill no data with shape slope
7
.01
6
y
y
2                condition with existing topo
.01
6
y
y
0                begin integration
.025
100
0
v
1
u
1
Save States
Save the flatMapVect statistics at the following number of iterations
- 1st
- 2nd
- 3rd
- 5th
- 10th
- 15th
- 20th
Examples

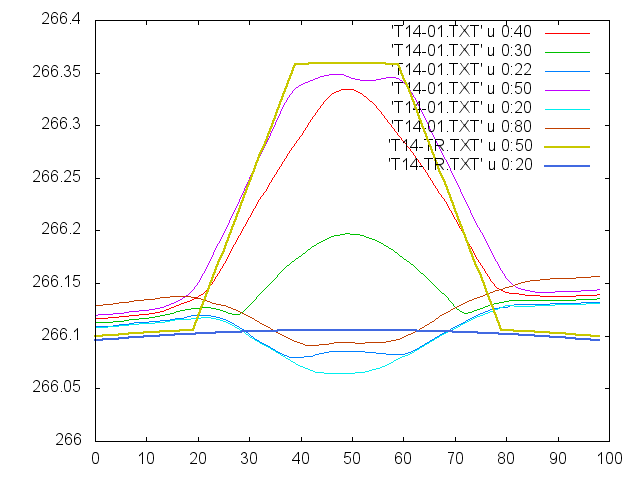
Example of a 14 degree peak, measured at difference locations 
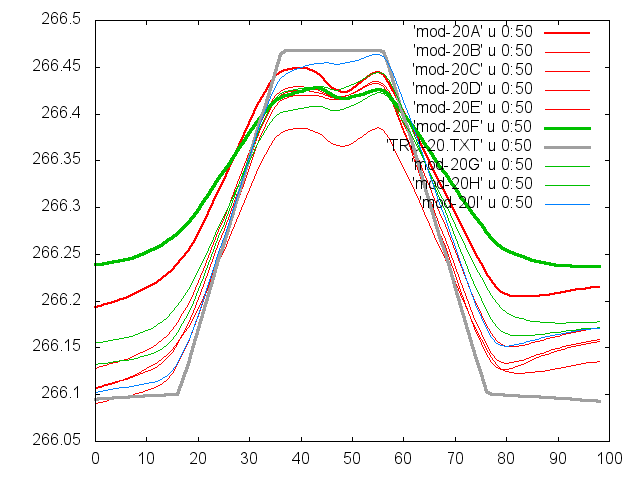
Example of a 20 degree peak, measured over time 
