OBoptimal Results (Tanner)
General Stats
Tiling step |
RMS (cm) |
5 cm |
2.158 |
2.5 cm |
1.988 |
1.25 cm |
1.782 |
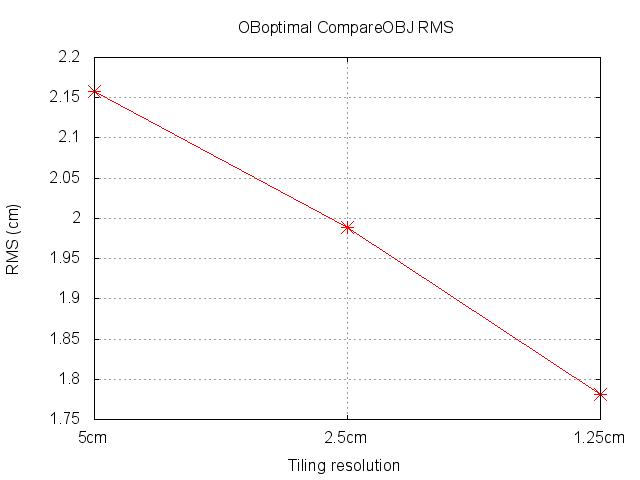
During this test we were still largely unhappy with the results we were getting from iterating so my test differed from Kris' in the sense that he iterated between each tiling and I did not. It is clear from our results, however, that the few iterations he did, did not have an overly adverse effect on the RMS of the evaluation site. Our final results differed by only 0.17%.
View Map RGB
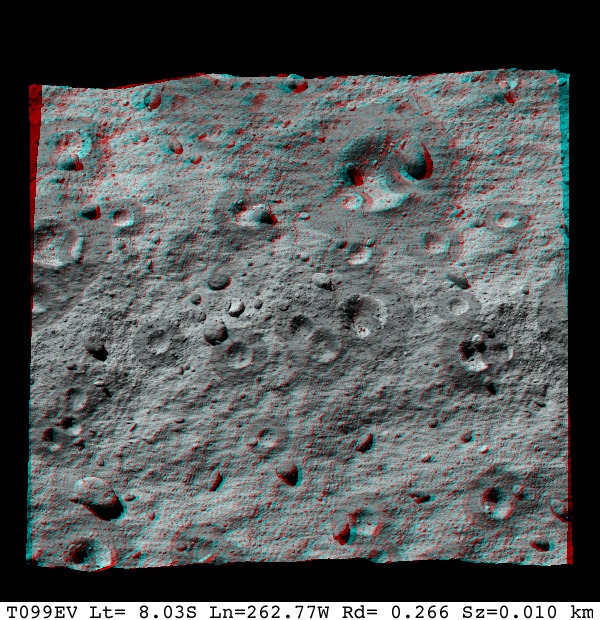
Truth |
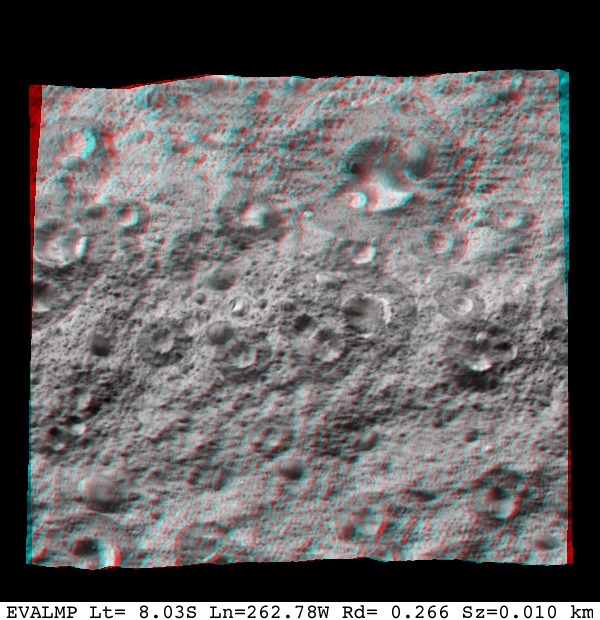
Model (1.25 cm GSD) |
|
|
Lockheed Martin Features
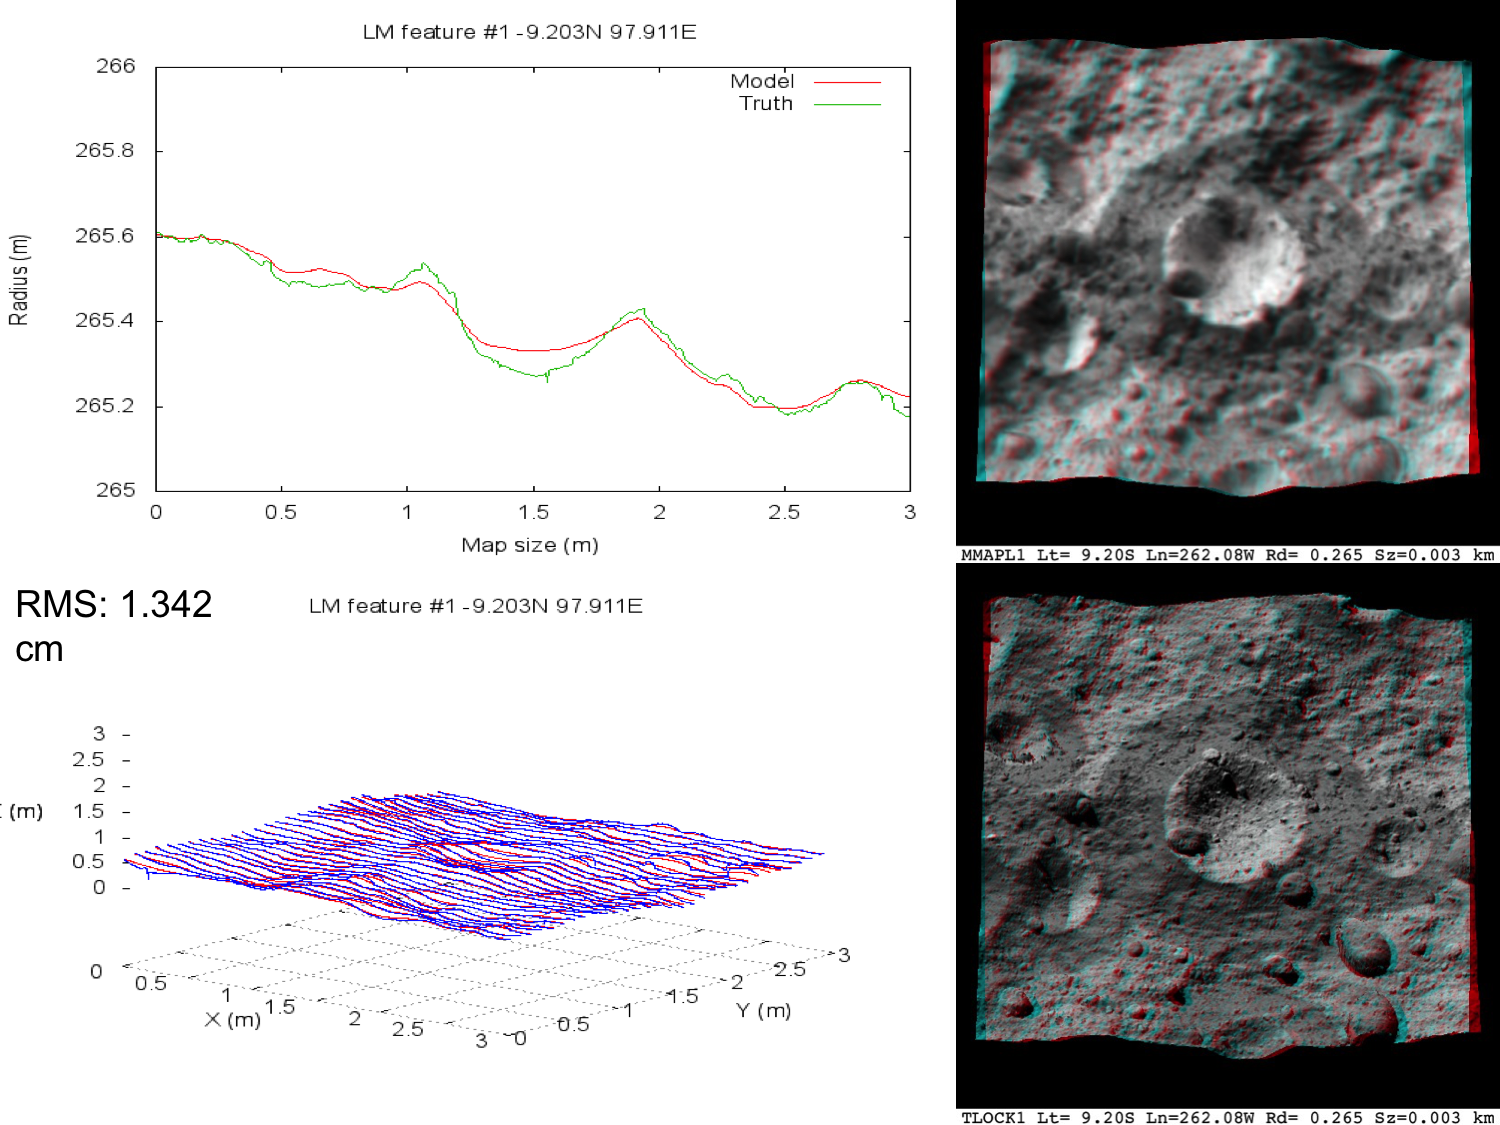
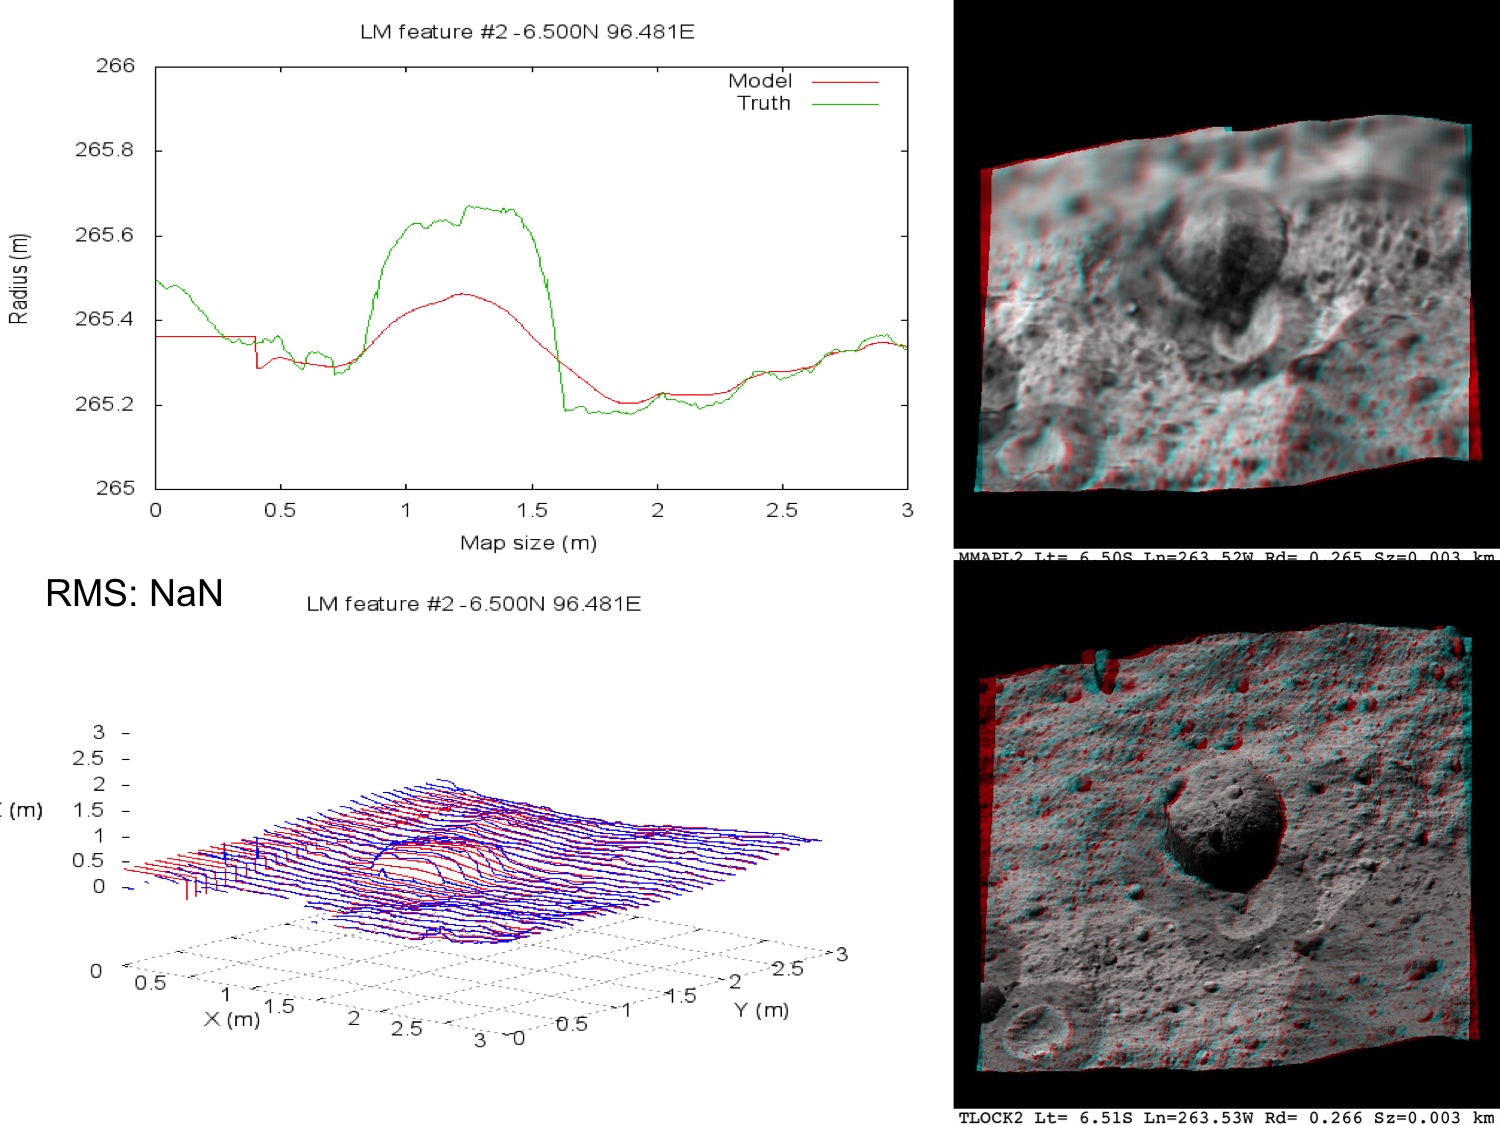
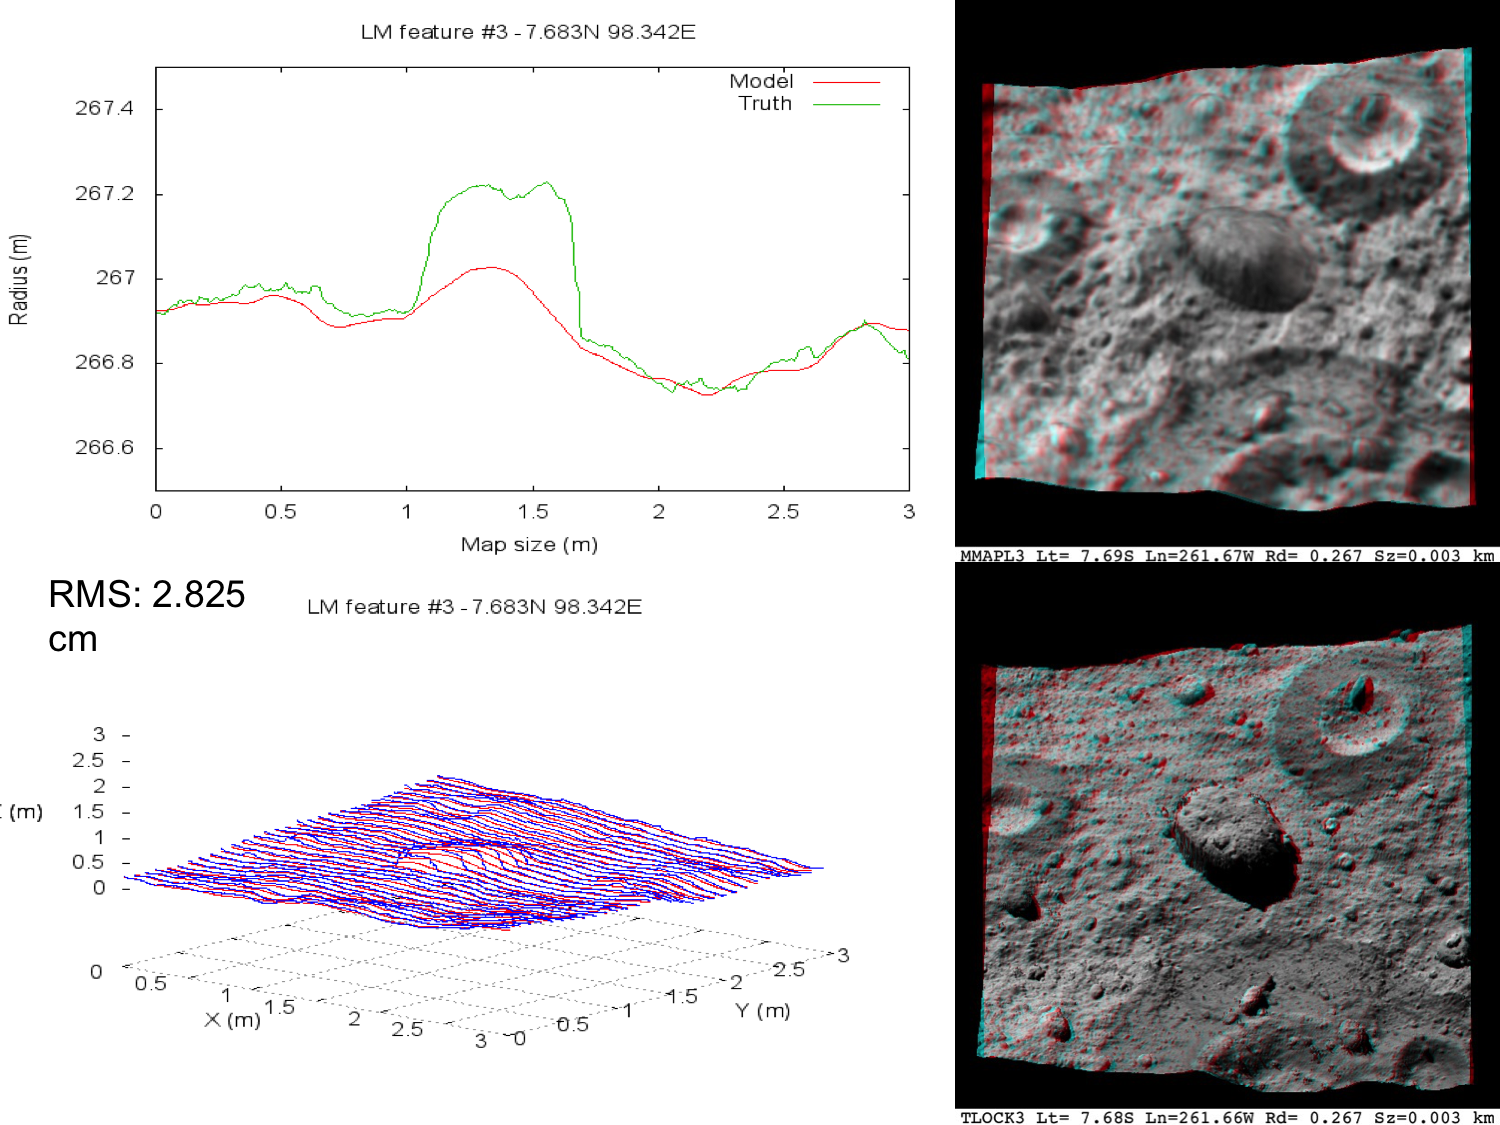
One of the driving factors of this test was to show that the current imaging plan for Orbit B as dictated by the mission was insufficient to produce the quality of topography needed for navigation. To help demonstrated this, we asked Lockheed Martin to directly compare five "features" of their choosing from both topography generated from the current DRM imaging campaign, and this OBoptimal data set. The following is an overview of the data sent to them for analysis from this data set.
Feature Translations
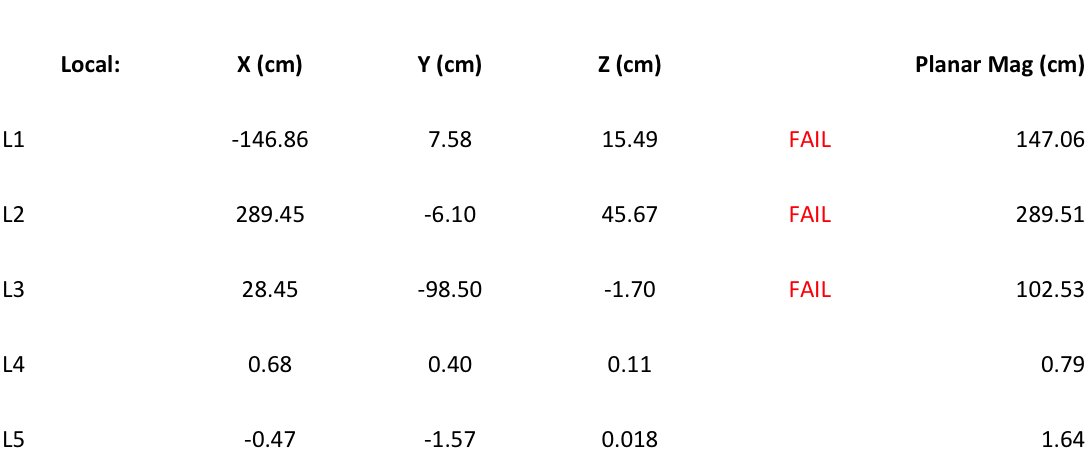
The table below shows the local x-y-z translations needed to minimize RMS between the model and the truth as given by CompareOBJ. The features marked with FAIL are marked so because CompareOBJ spit out an obviously erroneous translation. This is known to happen occasionally, especially when dealing with small areas of topography with under-represented features.
Feature 1
Feature 2
Feature 3
Feature 4
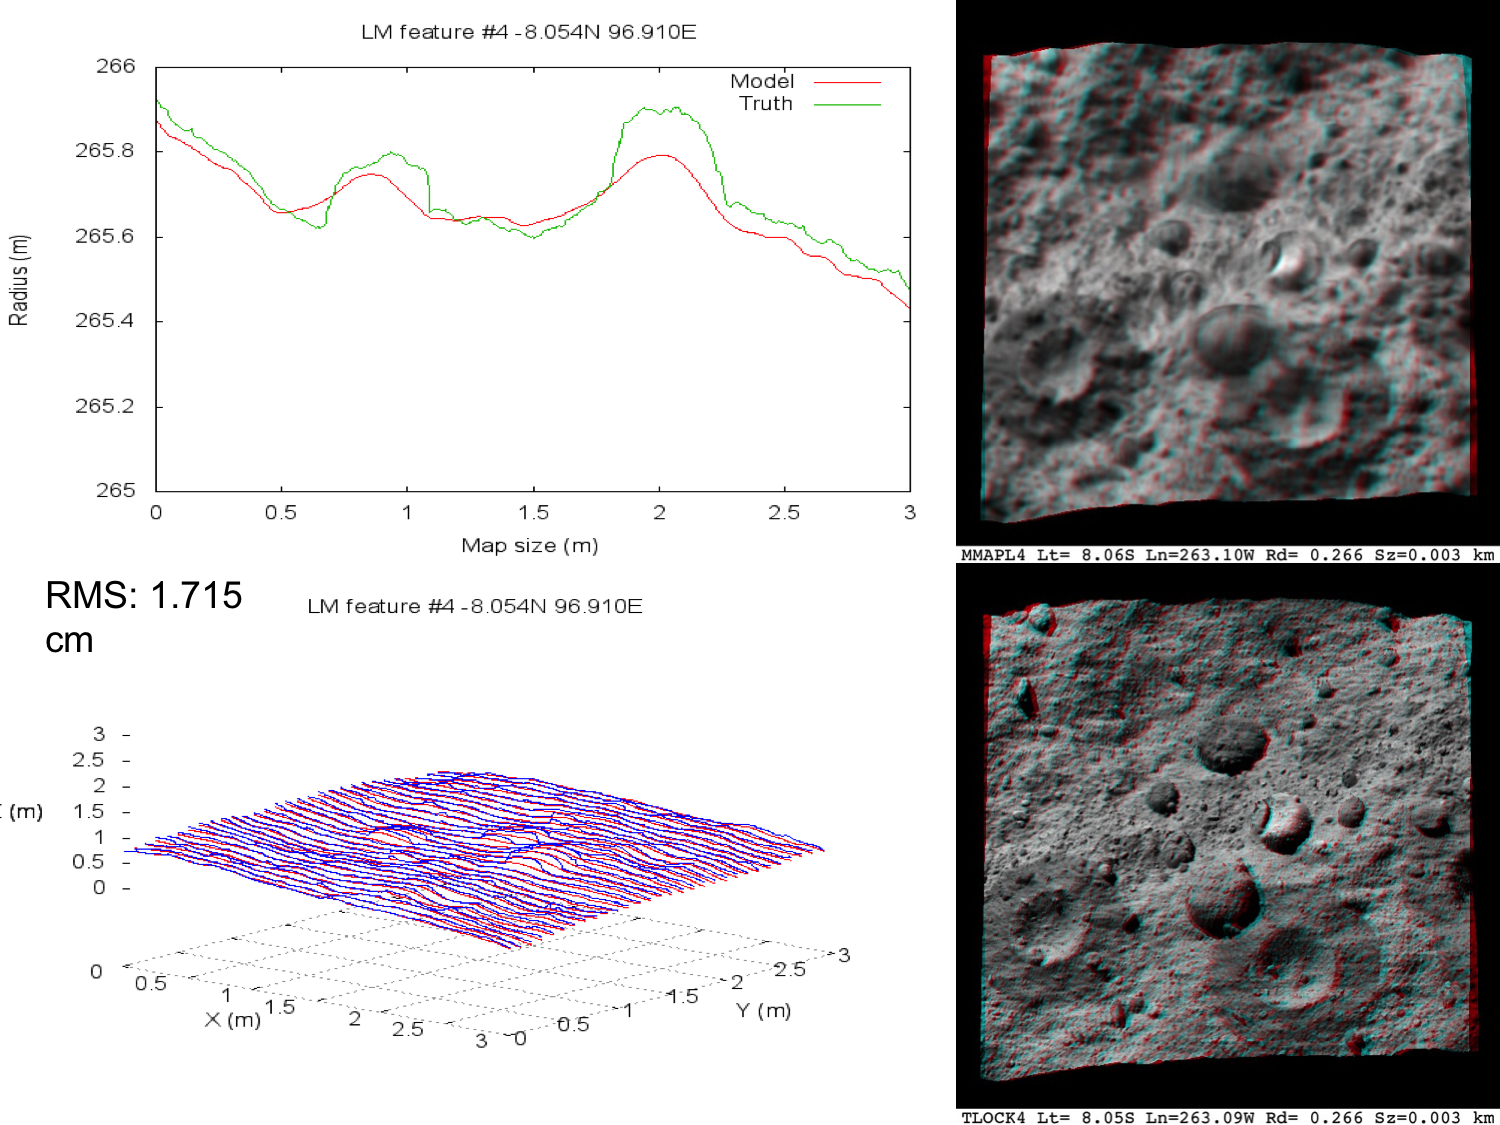
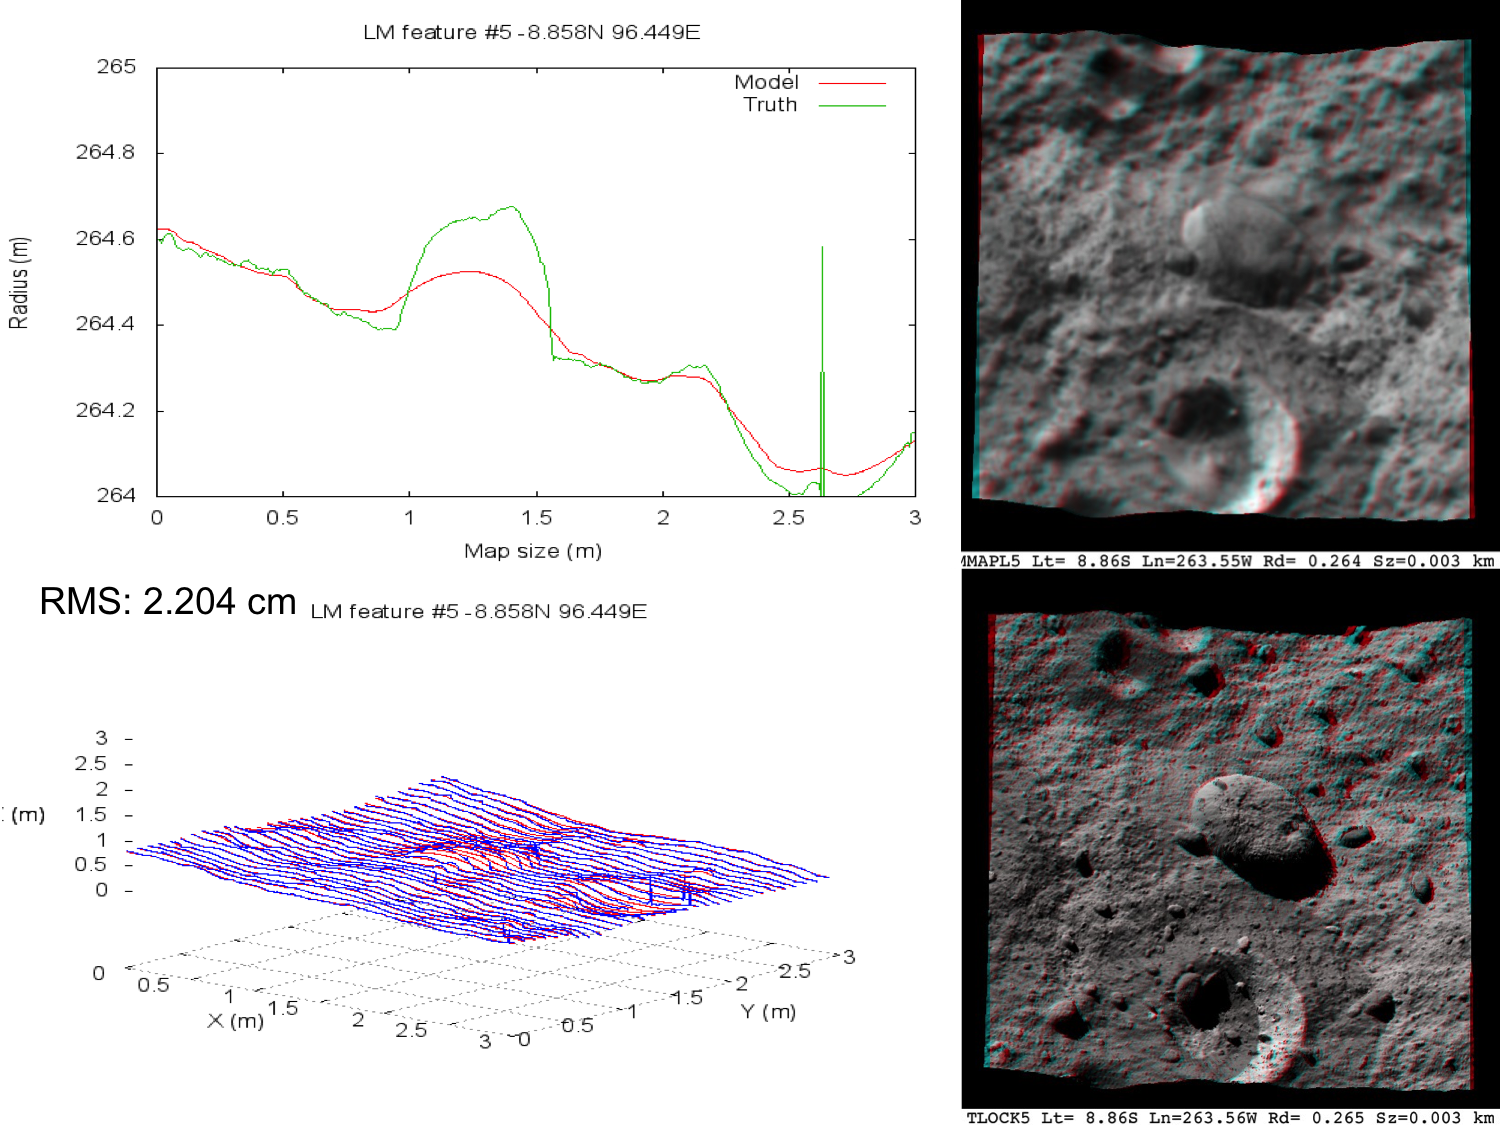
Feature 5
