|
Size: 1558
Comment:
|
Size: 1231
Comment:
|
| Deletions are marked like this. | Additions are marked like this. |
| Line 2: | Line 2: |
| Line 13: | Line 14: |
| == View Map RGB == | === View Map RGB === |
| Line 18: | Line 20: |
| == Topographical 2D Map == For this 2D map the colors indicate the difference between truth and effort heights at each pixel in meters. The blue color shows places on the tag site were the truth topography is lower than the effort's while the red shows places where the truth topography is higher than the effort's. Thus, from observing the traces, blue blotches are craters while the red blotches are boulders. Overall, this plot shows that that the deviation between is truth and effort mostly occurs at boulders and craters, which would cause the RMS from CompareOBJ to be higher than if than if the boulders and craters did not exist. |
== Lockheed Martin Features == |
| Line 21: | Line 22: |
| == Traces == This traces, show that the topography belonging to the effort follows that of the truth, but does not quite catch sharp jagged features, which is expected due to the smoothing that occurs during SPC. |
One of the driving factors of this test was to show that the current imaging plan for Orbit B as dictated by the mission was insufficient to produce the quality of topography needed for navigation. To help demonstrated this, we asked Lockheed Martin to directly compare five "features" of their choosing from both topography generated from the current DRM imaging campaign, and this OBoptimal data set. The following is an overview of the data sent to them for analysis from this data set. |
OBoptimal Results (Tanner)
General Stats
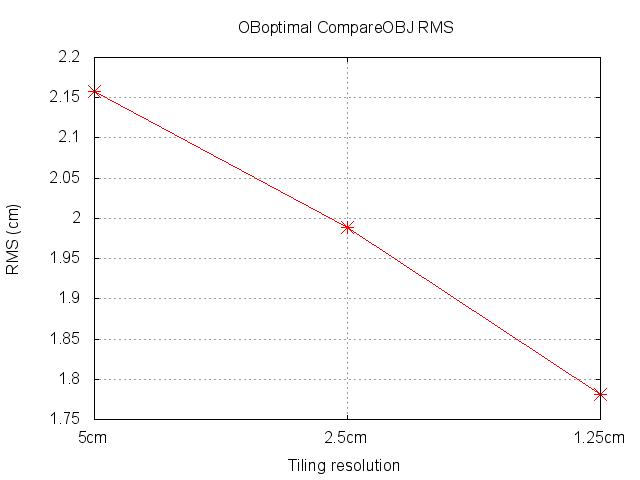
Tiling step |
RMS (cm) |
5 cm |
2.158 |
2.5 cm |
1.988 |
1.25 cm |
1.782 |

During this test we were still largely unhappy with the results we were getting from iterating so my test differed from Kris' in the sense that he iterated between each tiling and I did not. It is clear from our results, however, that the few iterations he did, did not have an overly adverse effect on the RMS of the evaluation site. Our final results differed by only 0.17%.
View Map RGB
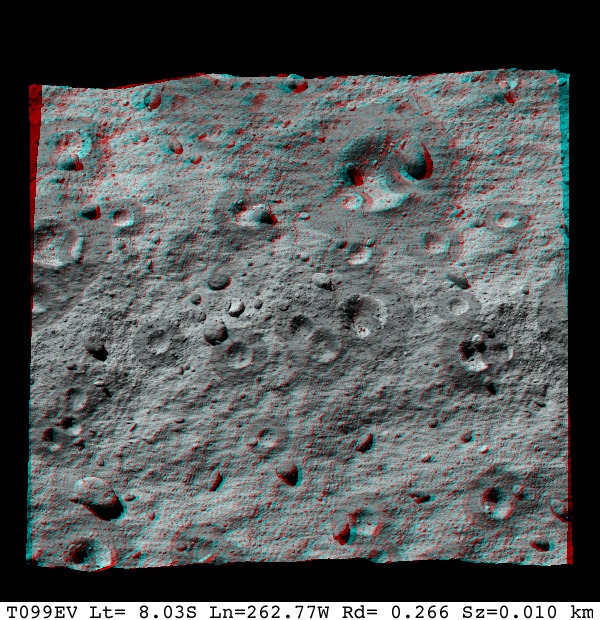
Truth |
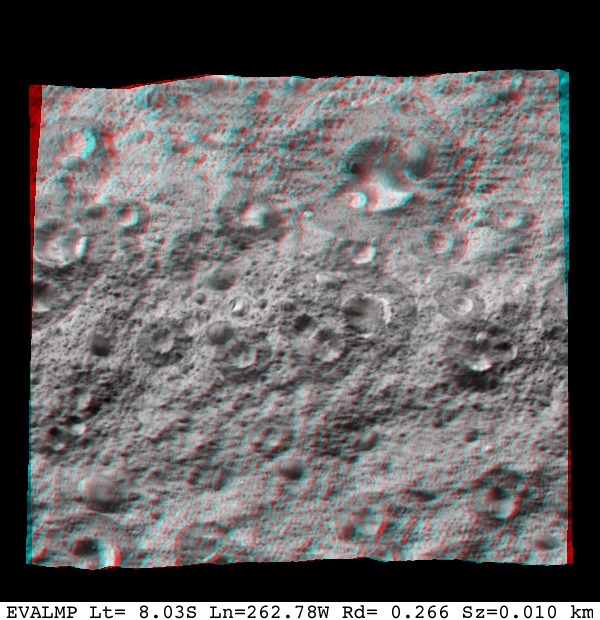
Model (1.25 cm GSD) |
|
|
Lockheed Martin Features
One of the driving factors of this test was to show that the current imaging plan for Orbit B as dictated by the mission was insufficient to produce the quality of topography needed for navigation. To help demonstrated this, we asked Lockheed Martin to directly compare five "features" of their choosing from both topography generated from the current DRM imaging campaign, and this OBoptimal data set. The following is an overview of the data sent to them for analysis from this data set.


