|
Size: 773
Comment:
|
Size: 773
Comment:
|
| Deletions are marked like this. | Additions are marked like this. |
| Line 9: | Line 9: |
| {{attachment:CompOBJ.png||width="600"}} | {{attachment:CompOBJ.png||width="800"}} |
| Line 15: | Line 15: |
| {{attachment:CompMapVec.png||width="600"}} | {{attachment:CompMapVec.png||width="800"}} |
| Line 19: | Line 19: |
| {{attachment:FormalUncertainty.png||width="600"}} | {{attachment:FormalUncertainty.png||width="800"}} |
Test Over11 F/G/H/I/J Comparative Results
Line Graphs
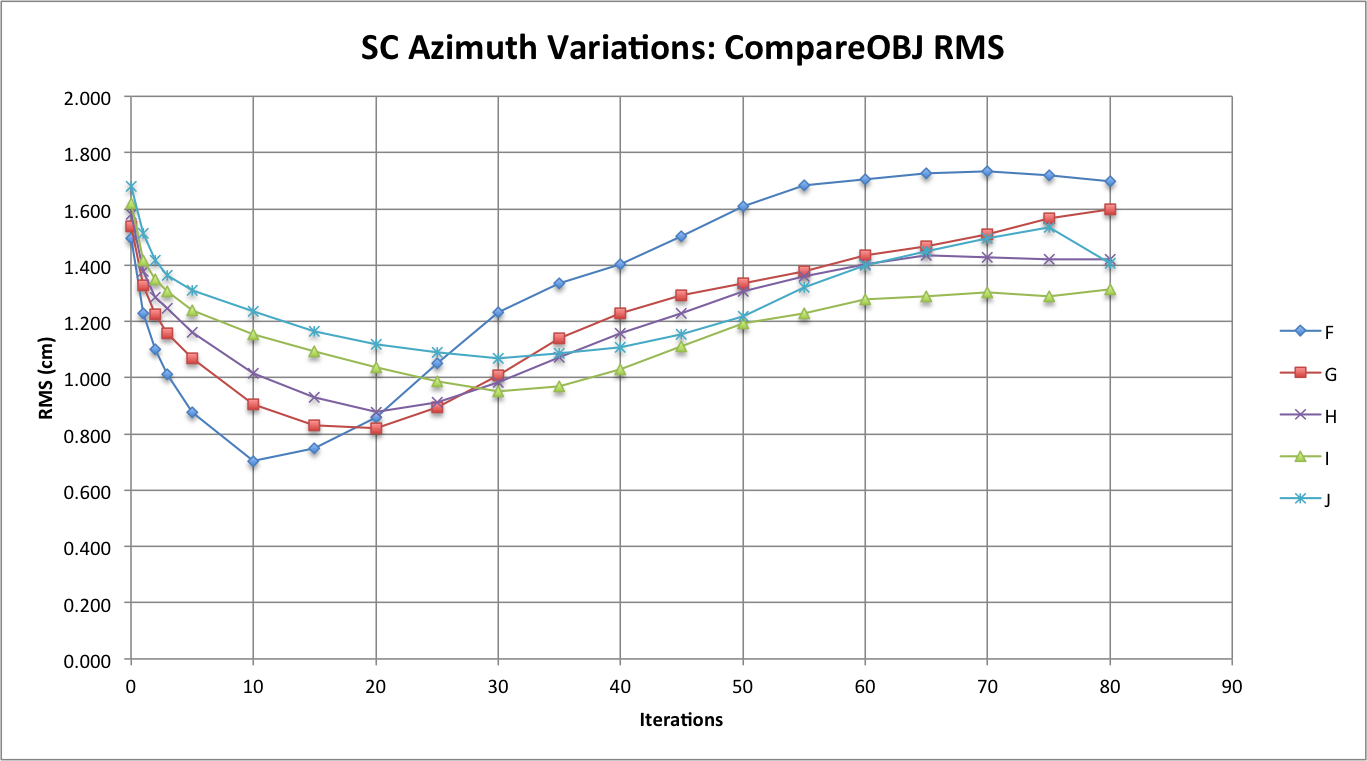
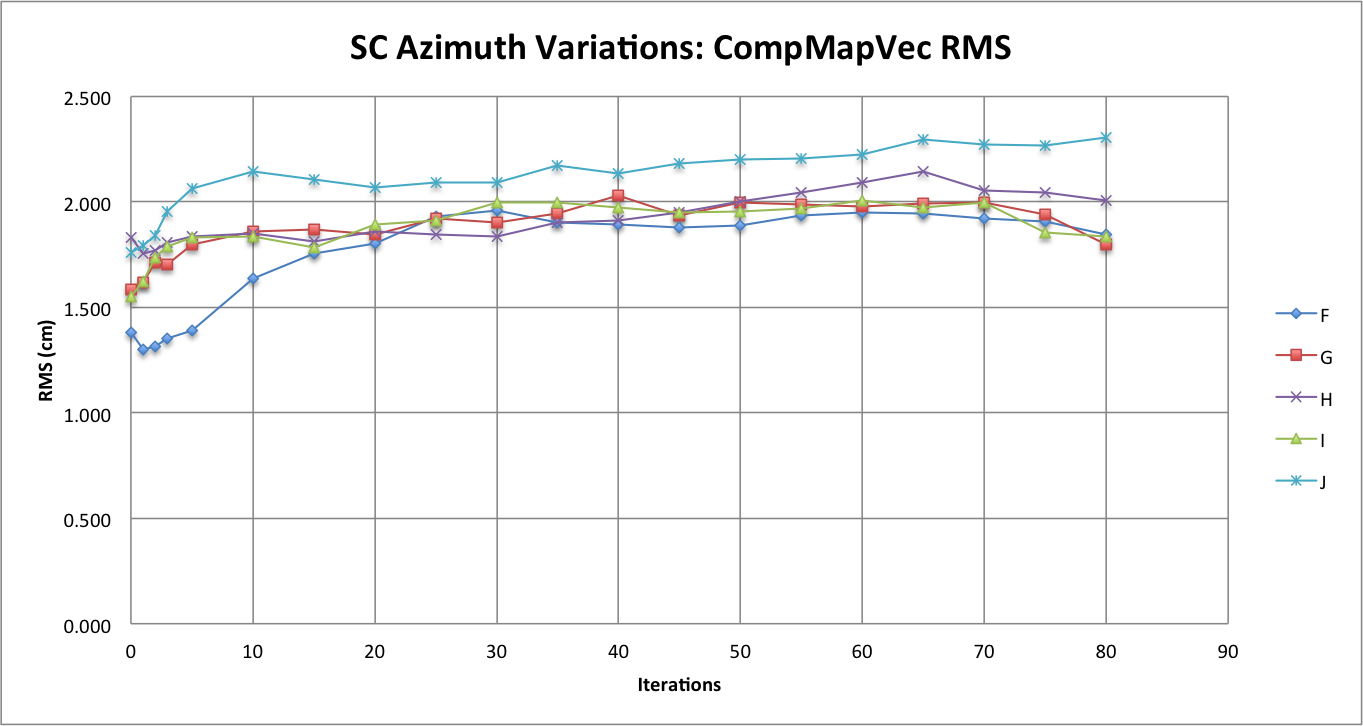
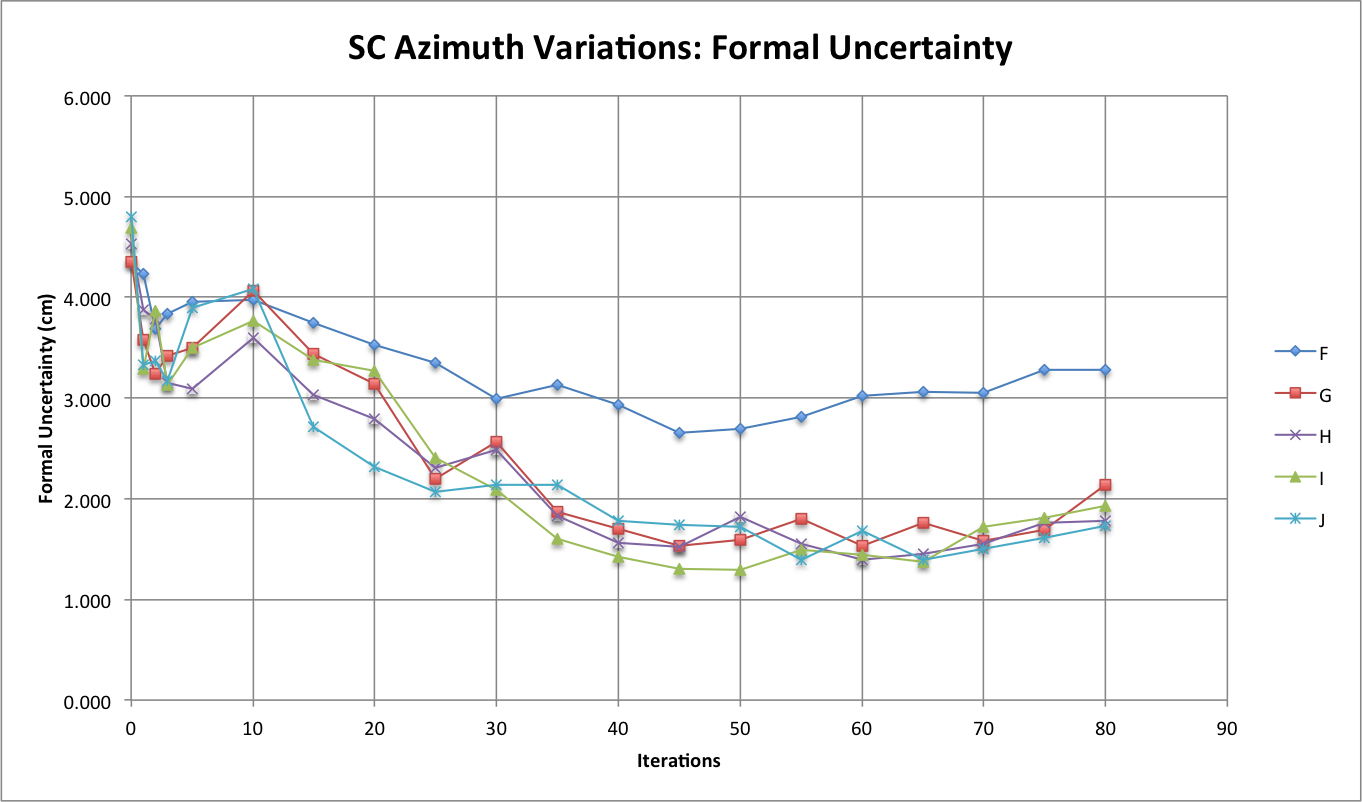
The following two figures are line graphs that show measurements of CompareOBJ's calculated RMS with and without optimal rotation & translation at each iteration. Furthermore, figures 3 and 4 show CompMapVec's calculated RMS and the measured formal uncertainty at each iteration respectfully. Note that iteration "0" is the tiling at 5 cm step.
Figure 1: CompareOBJ's Calculated RMS

Figure 2: CompareOBJ's Calculated RMS With Optimal Rot. & Trans.
Figure 3: CompMapVec's Calculated RMS

Figure 4: Measured Formal Uncertainty

