|
Size: 3450
Comment:
|
Size: 3516
Comment:
|
| Deletions are marked like this. | Additions are marked like this. |
| Line 5: | Line 5: |
| The following two figures are line graphs that show measurements of CompareOBJ's calculated RMS with and without optimal rotation & translation at each iteration. Furthermore, figures 3 and 4 show CompMapVec's calculated RMS and the measured formal uncertainty at each iteration respectfully. Note that iteration "0" is the tiling at 5 cm step. | The following two figures are line graphs that show measurements of CompareOBJ's calculated RMS with and without optimal rotation & translation at each iteration. Furthermore, figures 3 and 4 show CompMapVec's calculated RMS and the measured formal uncertainty at each iteration respectfully. A discussion of the observations are discussed below each figure. Note that iteration "0" is the tiling at 5 cm step. |
Test Over11 F/G/H/I/J Comparative Results
Line Graphs
The following two figures are line graphs that show measurements of CompareOBJ's calculated RMS with and without optimal rotation & translation at each iteration. Furthermore, figures 3 and 4 show CompMapVec's calculated RMS and the measured formal uncertainty at each iteration respectfully. A discussion of the observations are discussed below each figure. Note that iteration "0" is the tiling at 5 cm step.
Figure 1: CompareOBJ's Calculated RMS
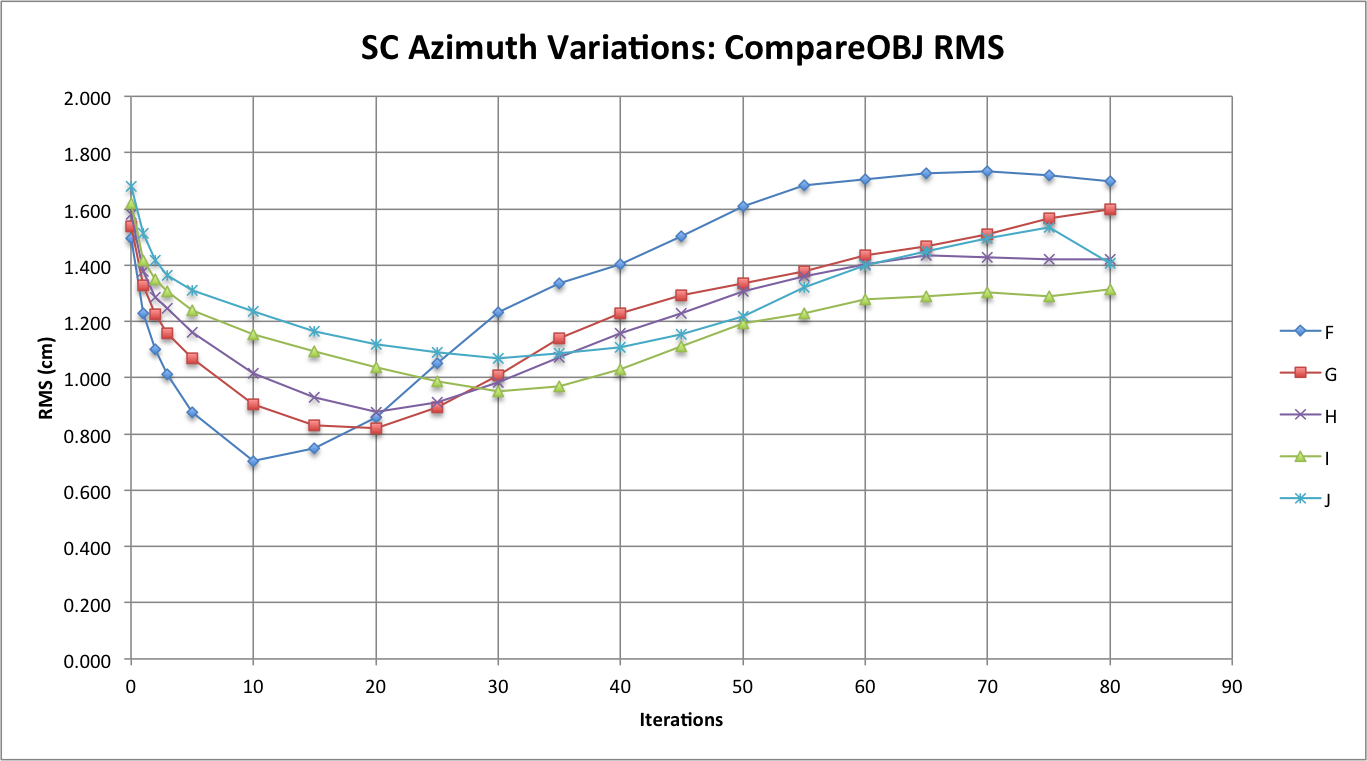
Figure 2: CompareOBJ's Calculated RMS With Optimal Rot. & Trans.
Figure 3: CompMapVec's Calculated RMS
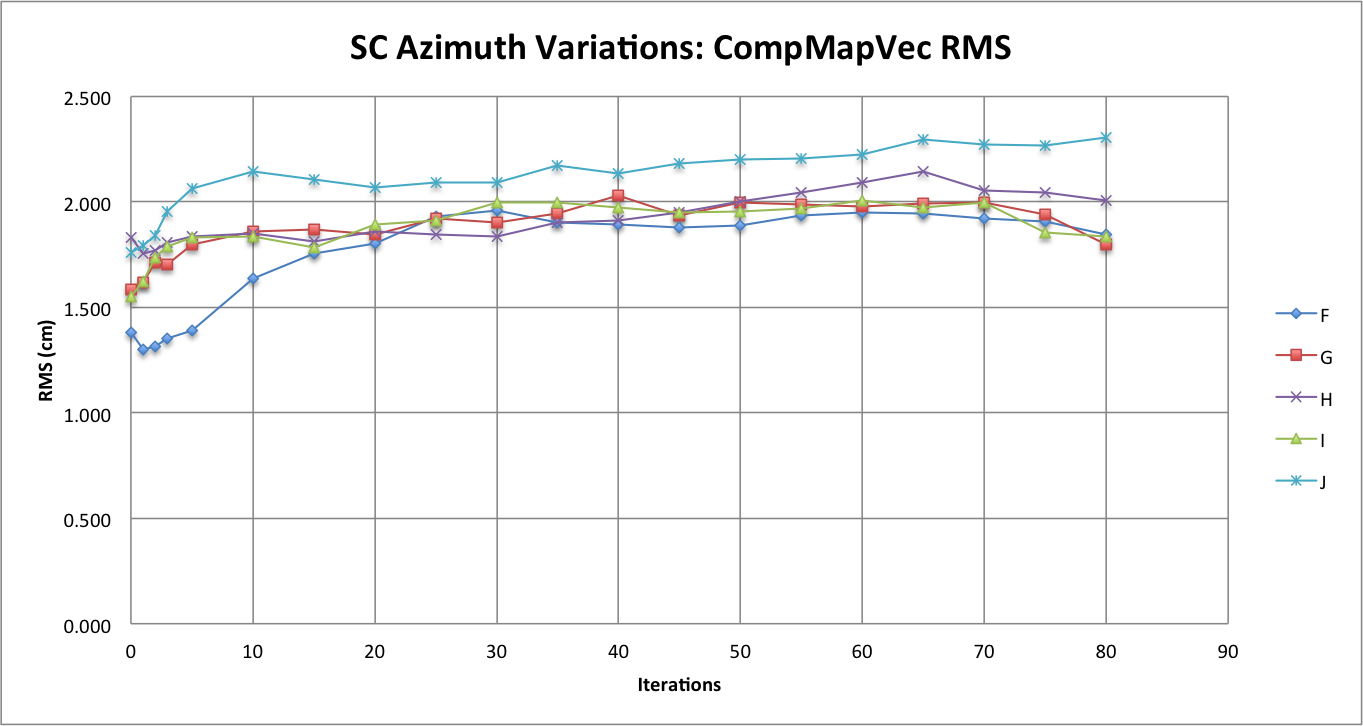
Figure 4: Measured Formal Uncertainty
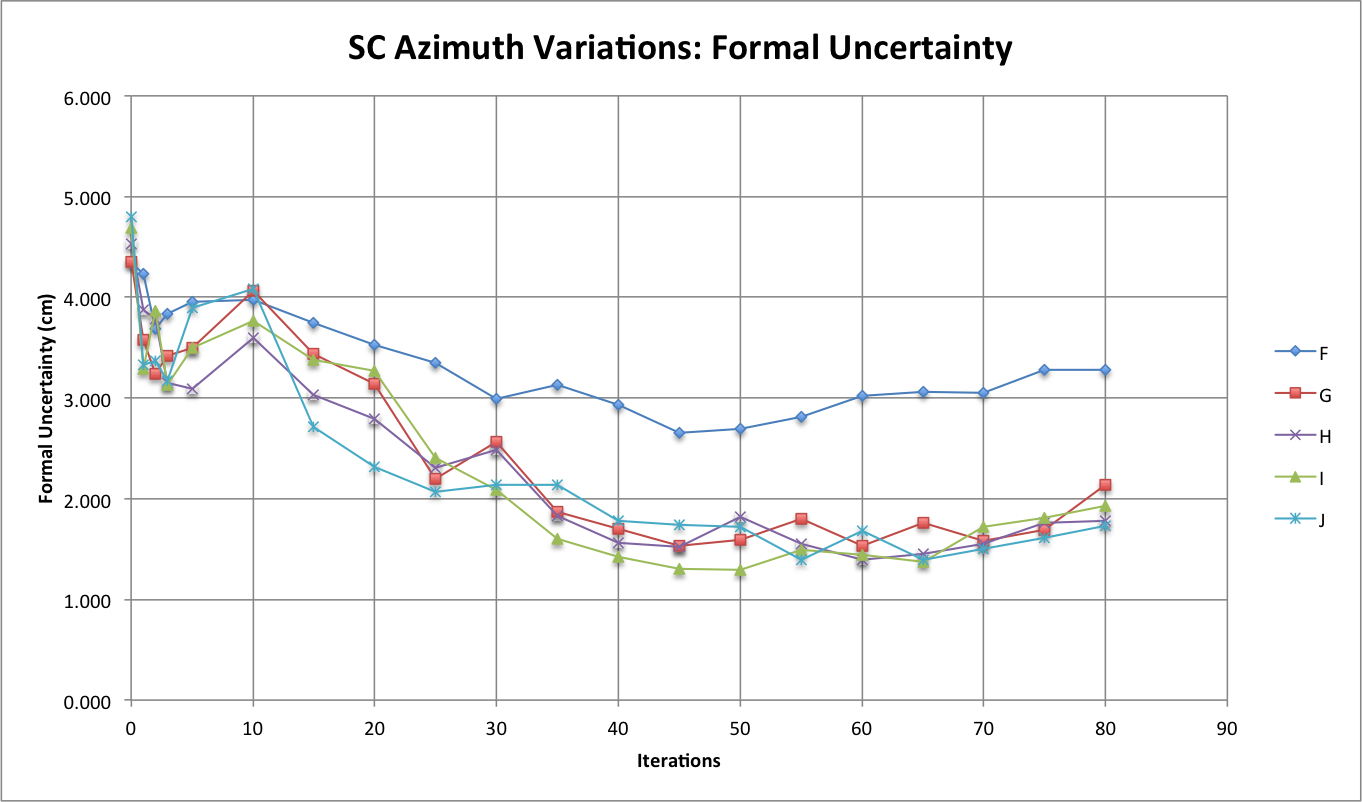
The observation that sticks out the most when comparing the formal uncertainty between the Azimuth Variations Tests is that at higher iterations the formal uncertainties for Tests G, H, I, and J seem to be hovering around one another while the formal uncertainty for Test F about 1 cm greater than the formal uncertainty for all the other Azimuth Variation Tests. By looking at figure 1, one will also notice that CompareOBJ's calculated RMS for Test F is also the highest CompareOBJ calculated RMS for all the Azimuth Variation Tests at relatively higher ( more than 30) iterations. Figure 3, also shows CompMapVec's calculated RMS for Test F to be greater than all the CompMapVec calculated RMS for all the other Azimuth Variation Tests throughout the iterative Process. Furthermore, CompMapVec's calculated RMS and CompareOBJ's calculated RMS for Tests G, H, I, and J are all closer to one another throughout the iterative process. Thus, a conclusion can made that at a specific azimuthal representation, the formal uncertainty starts to be distinctly greater than when less azimuthal representation. From Figure 4, it appears the azimuthal representation where the formal uncertainty is a lot greater is somewhere between every 30 degrees (Test G) and every 20 degrees (Test F).
Traces: North to South
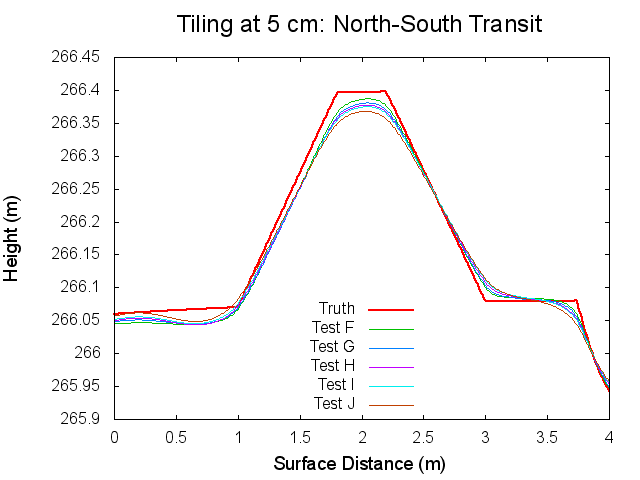
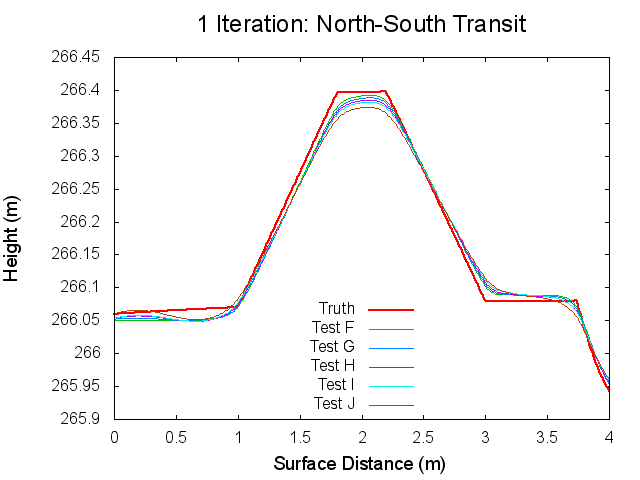
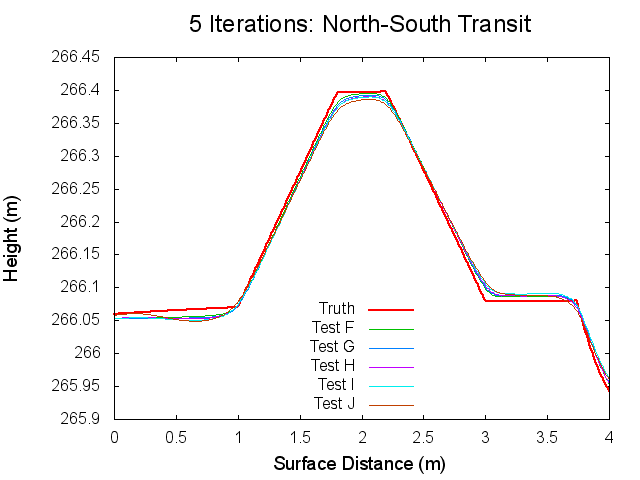
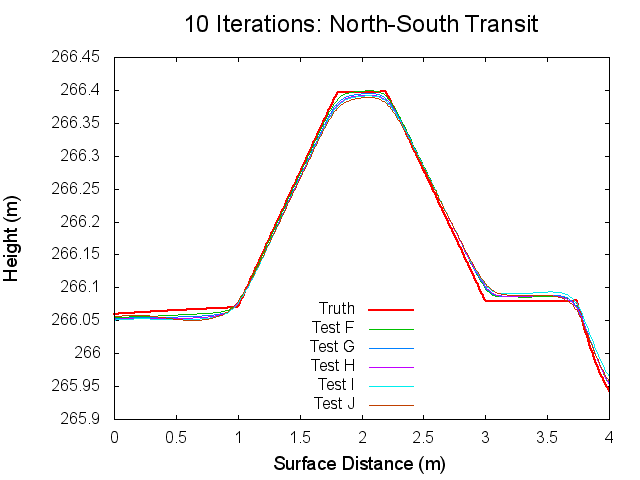
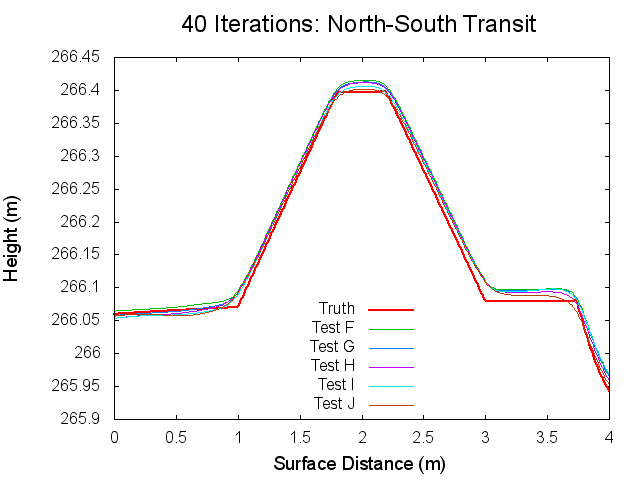
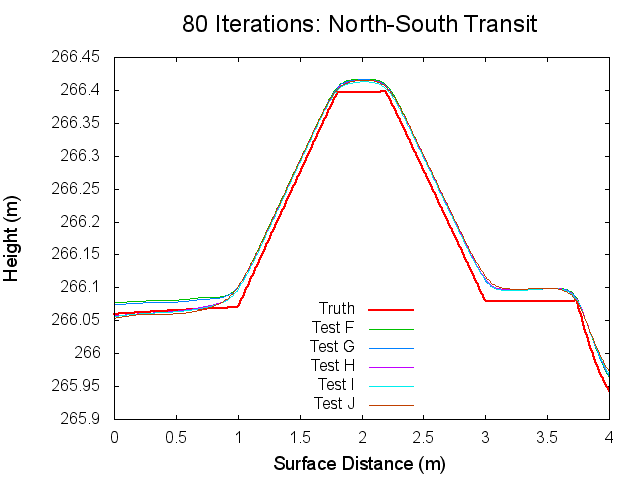
The following figures are topographical transits of the test bigmaps through the center (North to South) at various iterations throughout the SPC process.
Figures 5 through 10: North to South Traces of F/G/H/I/J Tests at various iterations
Traces: West to East
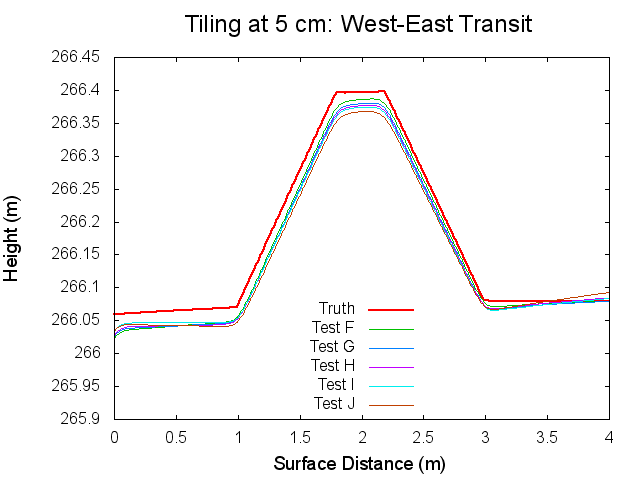
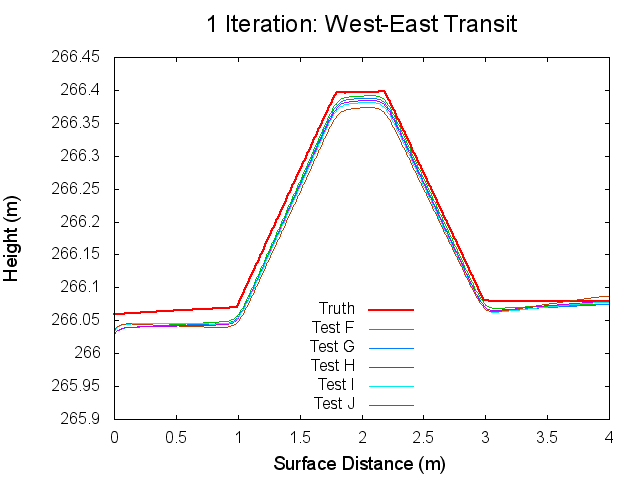
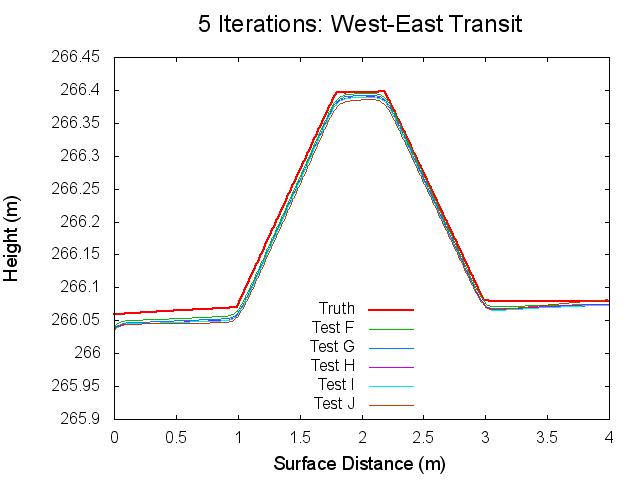
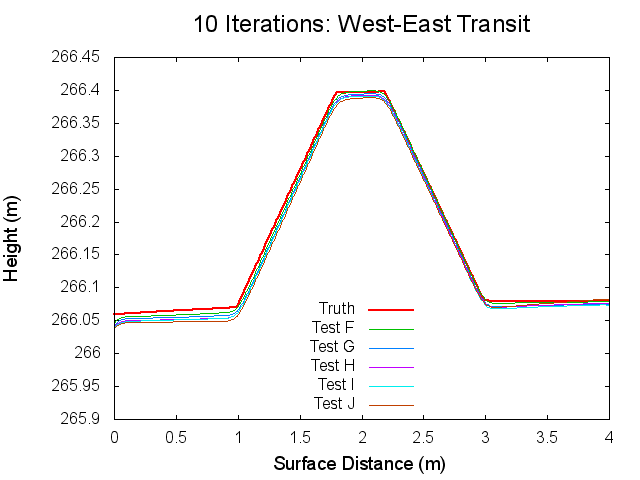
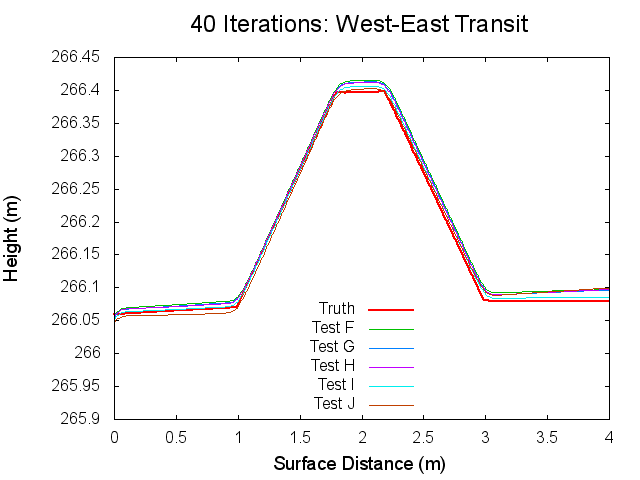
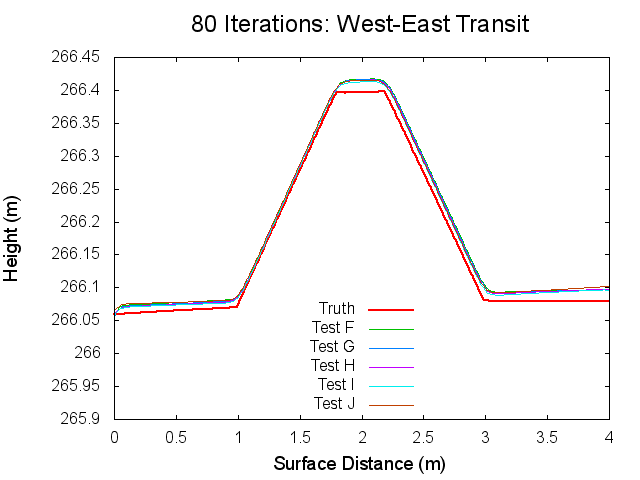
The following figures are topographical transits of the test bigmaps through the center (West to East) at various iterations throughout the SPC process.
Figures 11 through 16: West to East Traces of F/G/H/I/J Tests at various iterations
