|
Size: 2073
Comment:
|
← Revision 24 as of 2015-12-07 17:00:37 ⇥
Size: 3156
Comment:
|
| Deletions are marked like this. | Additions are marked like this. |
| Line 1: | Line 1: |
| ## page was renamed from Over11S | |
| Line 2: | Line 3: |
| Line 4: | Line 6: |
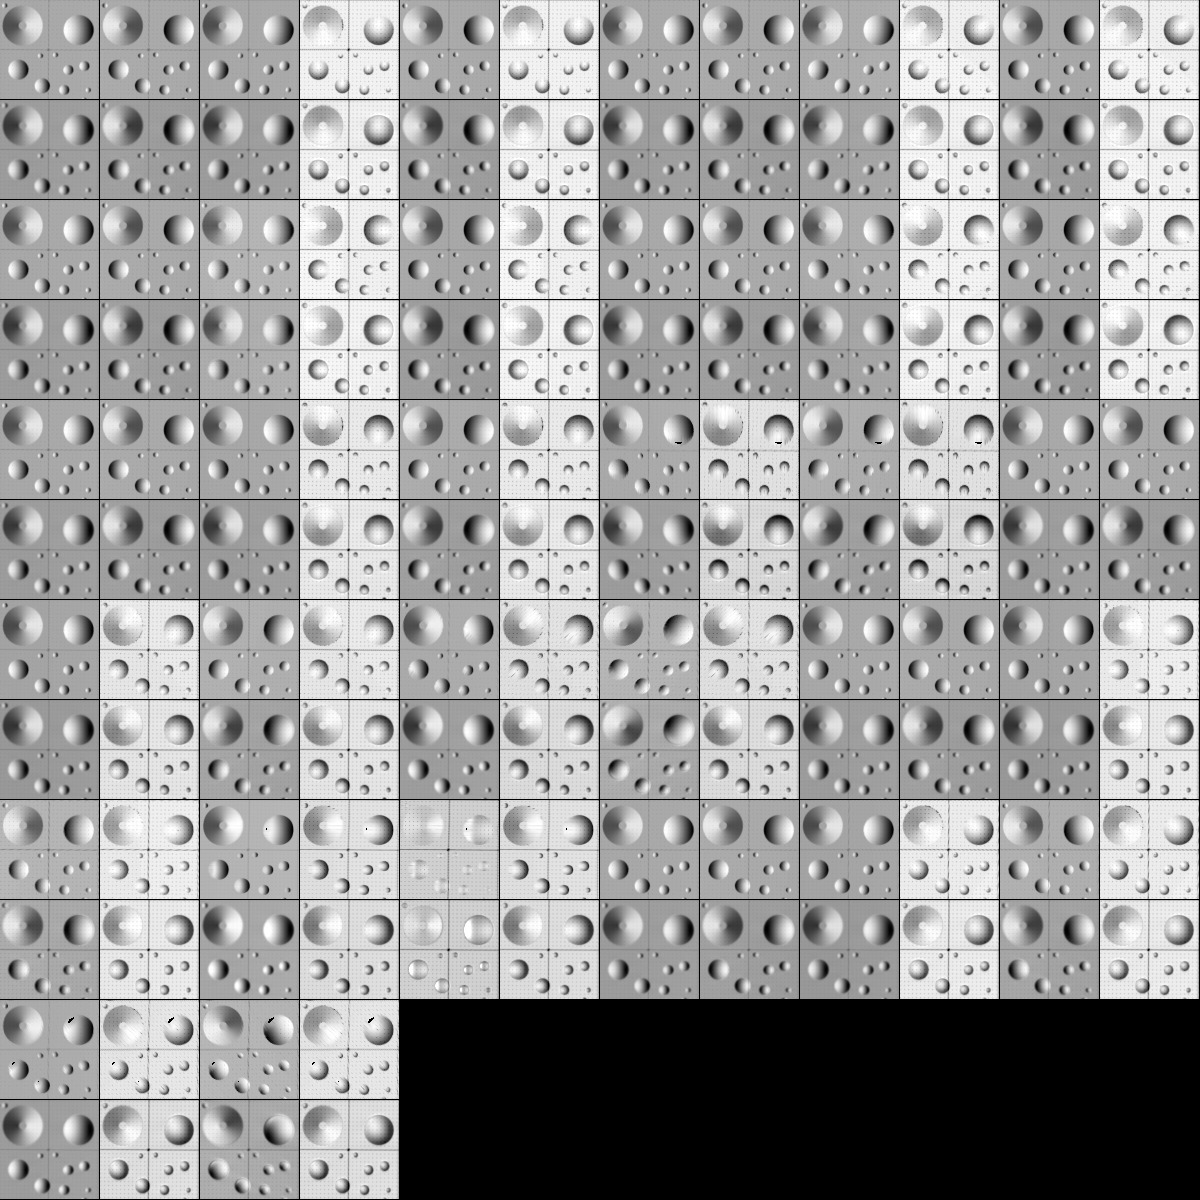
| Image suite: One 5cm resolution image for each Sun&S/C combination: Sun at 45deg, -0, -45deg; S/C at every 45deg Azimuth; 0, 30deg, 60deg Zenith. Model bigmap parameters: GSD = 1cm, Q = 200 (width=4m), centered at REGION.MAP, 966, 1005 (lat, wlong). |
Evaluation bigmap parameters: GSD = 1cm, Q = 200 (width=4m), centered at REGION.MAP, 966, 1005 (pixel/line location). |
| Line 13: | Line 10: |
| Please see results under Tables and Figures, below. An inspection of the transits and heat plots reveals that, at 50 iterations, the solution has not converged. The North-South and West-East central transits continue to drift with the heights monotonically increasing. This corresponds with a decreasing residual and somewhat diverging RMS values. == Tables and Figures == {{attachment:Over11S-100-resized.png}} |
|
| Line 15: | Line 20: |
| ||'''CompareOBJ-RMS(cm)'''||'''CompareOBJ-RMS with Opt Trans & Rot (cm)'''||'''CompMapVec-RMS(cm)'''|| ||3.357||1.043||1.660|| |
||'''Formal Uncertainty (cm)'''||'''CompareOBJ-RMS(cm)'''||'''CompareOBJ-RMS with Opt Trans & Rot (cm)'''||'''CompMapVec-RMS(cm)'''|| ||4.589||3.357||1.043||1.660|| |
| Line 20: | Line 25: |
| ||'''CompareOBJ-RMS(cm)'''||'''CompareOBJ-RMS with Opt Trans & Rot (cm)'''||'''CompMapVec-RMS(cm)'''|| ||1.537||0.882||1.199|| |
||'''Formal Uncertainty (cm)'''||'''CompareOBJ-RMS(cm)'''||'''CompareOBJ-RMS with Opt Trans & Rot (cm)'''||'''CompMapVec-RMS(cm)'''|| ||3.841||1.537||0.882||1.199|| |
| Line 25: | Line 30: |
| ||'''Iteration'''||'''CompareOBJ-RMS(cm)'''||'''CompareOBJ-RMS with Opt Trans & Rot (cm)'''||'''CompMapVec-RMS(cm)'''|| ||1||1.331||0.785||1.376|| ||2||1.263||0.687||1.501|| ||3||1.239||0.632||1.593|| ||5||1.211||0.578||1.685|| ||10||1.171||0.527||1.749|| ||15||1.146||0.518||1.779|| ||20||1.110||0.507||1.892|| |
||'''Iteration'''||'''Formal Uncertainty (cm)'''||'''CompareOBJ-RMS(cm)'''||'''CompareOBJ-RMS with Opt Trans & Rot (cm)'''||'''CompMapVec-RMS(cm)'''|| ||1||2.662||1.331||0.785||1.376|| ||2||3.476||1.263||0.687||1.501|| ||3||3.122||1.239||0.632||1.593|| ||5||3.134||1.211||0.578||1.685|| ||10||3.394||1.171||0.527||1.749|| ||15||2.968||1.146||0.518||1.779|| ||20||2.284||1.110||0.507||1.892|| ||25||2.173||1.060||0.517||1.947|| ||30||1.923||1.035||0.527||1.984|| ||35||1.848||1.036||0.566||2.002|| ||40||1.510||1.077||0.608||1.996|| ||45||1.444||1.152||0.650||2.048|| ||50||1.431||1.253||0.686||2.081|| ||60||1.383||1.454||0.655||2.115|| ||70||1.469||1.670||0.601||2.182|| ||80||1.328||1.886||0.543||2.188|| ||90||1.326||2.082||0.535||2.283|| ||100||1.473||2.199||0.534||2.362|| |
| Line 37: | Line 53: |
| '''Traces Running North-South:''' | {{attachment:transit200-It0-10.png}} {{attachment:transposedTransit200-It0to10.png}} |
| Line 39: | Line 56: |
| {{attachment:transit200.png}} | {{attachment:transit200-It10-50.png}} {{attachment:transposedTransit200-It10to50.png}} |
| Line 41: | Line 59: |
| '''Traces Running West-East:''' {{attachment:transposedTransit200.png}} |
{{attachment:transit200-it50to100.png}} {{attachment:transposedTransit200-It50to100.png}} |
| Line 49: | Line 65: |
| Line 51: | Line 66: |
| Line 53: | Line 67: |
| Line 55: | Line 68: |
{{attachment:heatPlot-T11RFS-05stepB025-1cm-4m.png}} |
|
| Line 59: | Line 69: |
{{attachment:heatPlot-T11RFS-05stepB035-1cm-4m.png}} |
|
| Line 63: | Line 70: |
{{attachment:heatPlot-T11RFS-05stepB045-1cm-4m.png}} |
|
| Line 67: | Line 71: |
| {{attachment:heatPlot-T11RFS-05stepB060-1cm-4m.png}} {{attachment:heatPlot-T11RFS-05stepB070-1cm-4m.png}} {{attachment:heatPlot-T11RFS-05stepB080-1cm-4m.png}} {{attachment:heatPlot-T11RFS-05stepB090-1cm-4m.png}} {{attachment:heatPlot-T11RFS-05stepB100-1cm-4m.png}} |
Test 11S - With Overlaps
Truth topography: flat-topped cone with 20deg slope within a landscape of cones and craters.
Evaluation bigmap parameters: GSD = 1cm, Q = 200 (width=4m), centered at REGION.MAP, 966, 1005 (pixel/line location).
Results
Please see results under Tables and Figures, below.
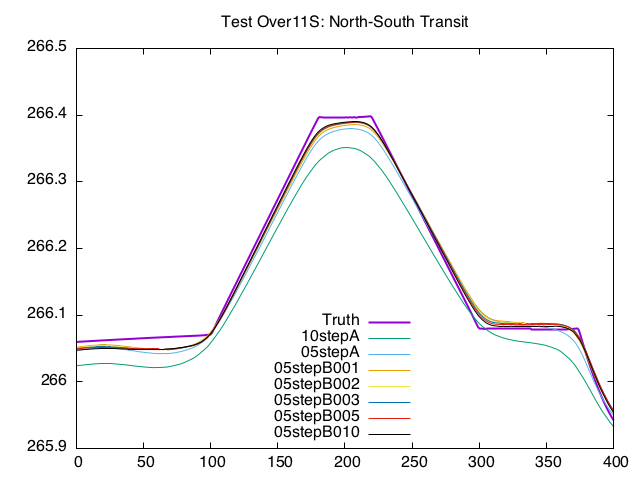
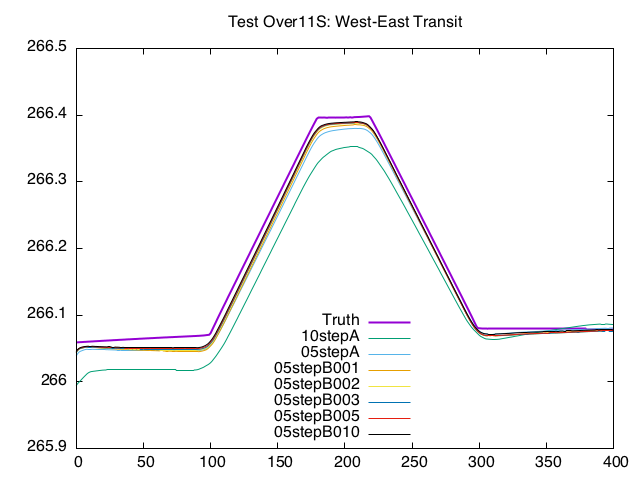
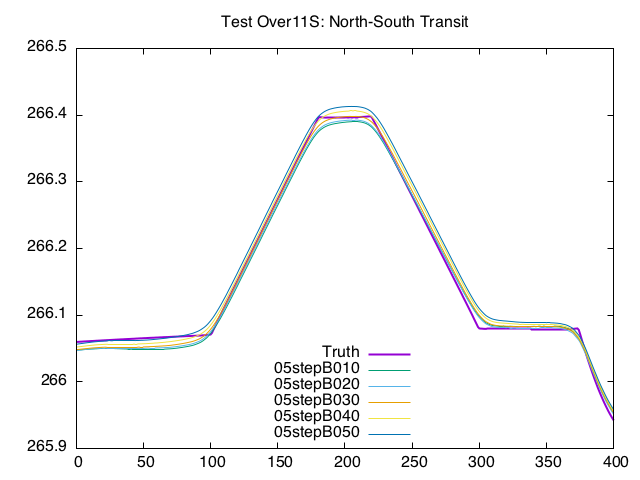
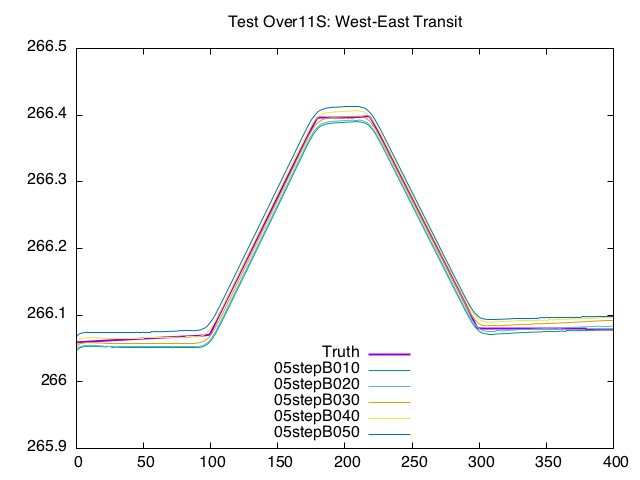
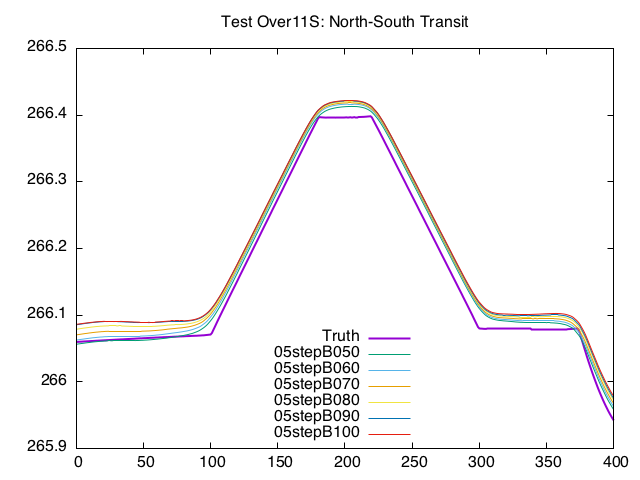
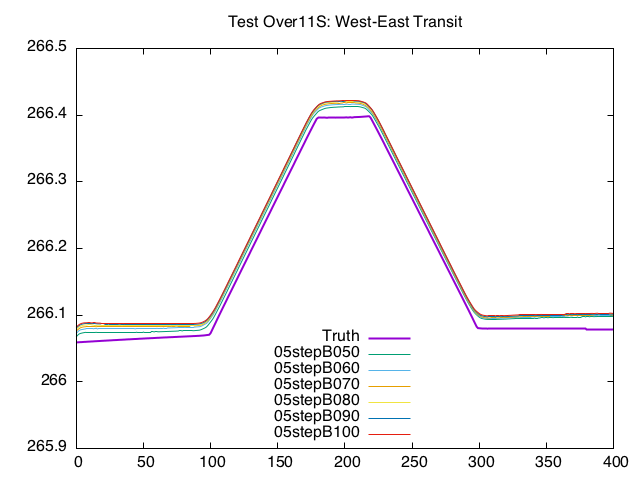
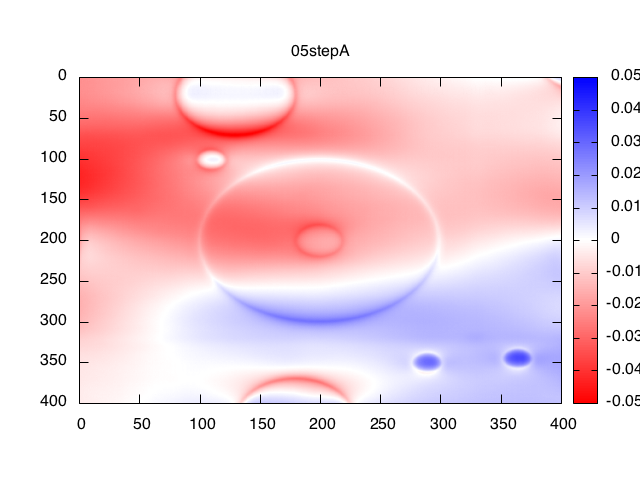
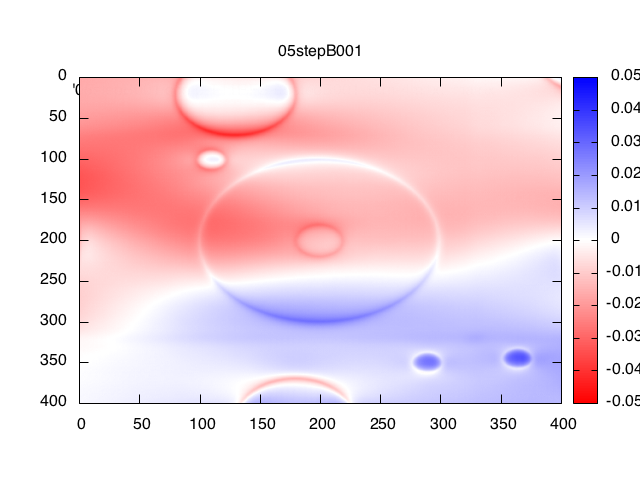
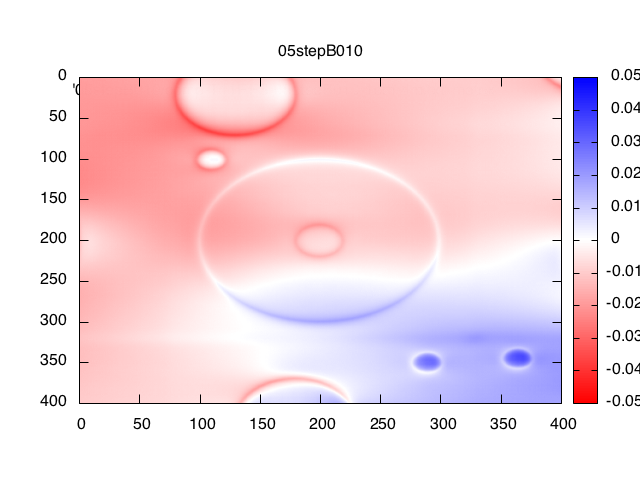
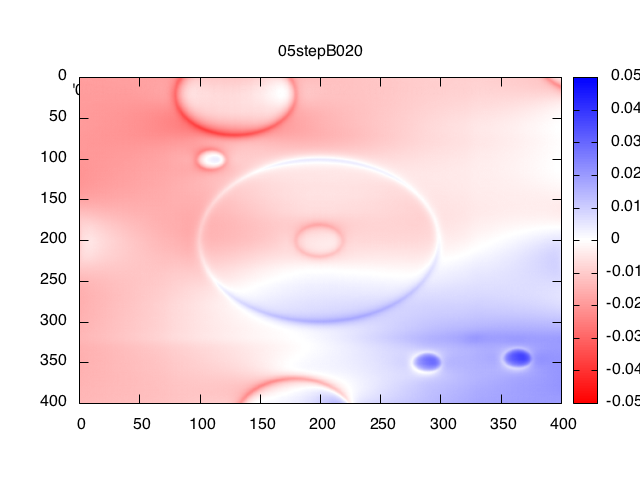
An inspection of the transits and heat plots reveals that, at 50 iterations, the solution has not converged. The North-South and West-East central transits continue to drift with the heights monotonically increasing. This corresponds with a decreasing residual and somewhat diverging RMS values.
Tables and Figures
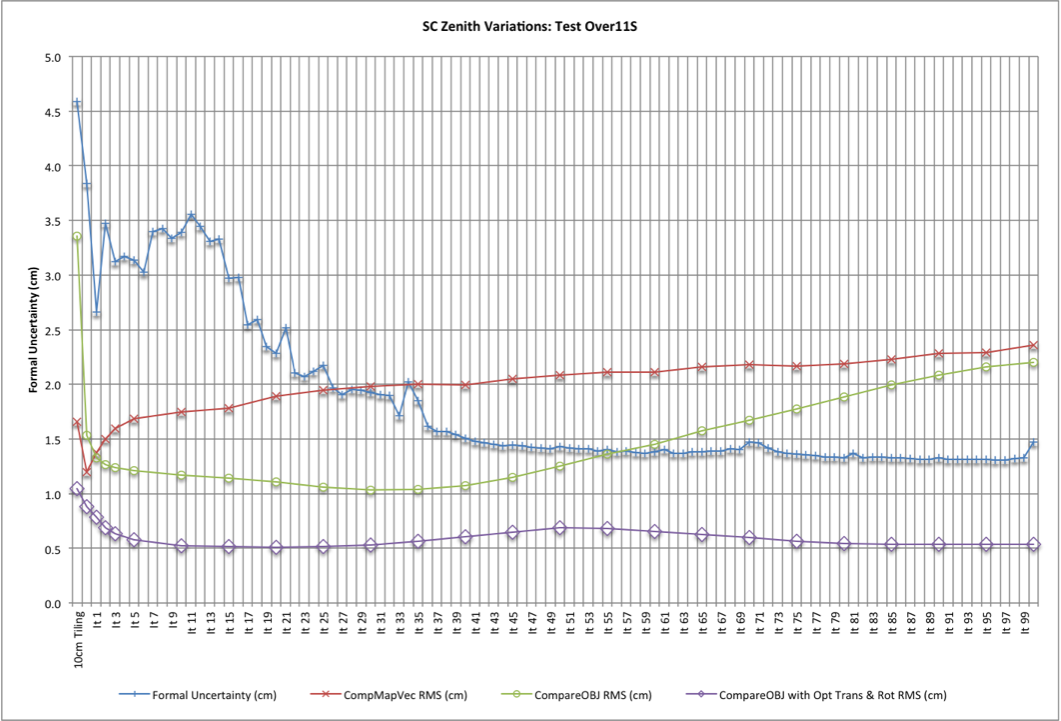
10cm Tiling:
Formal Uncertainty (cm) |
CompareOBJ-RMS(cm) |
CompareOBJ-RMS with Opt Trans & Rot (cm) |
CompMapVec-RMS(cm) |
4.589 |
3.357 |
1.043 |
1.660 |
5cm Tiling:
Formal Uncertainty (cm) |
CompareOBJ-RMS(cm) |
CompareOBJ-RMS with Opt Trans & Rot (cm) |
CompMapVec-RMS(cm) |
3.841 |
1.537 |
0.882 |
1.199 |
5cm Iterations:
Iteration |
Formal Uncertainty (cm) |
CompareOBJ-RMS(cm) |
CompareOBJ-RMS with Opt Trans & Rot (cm) |
CompMapVec-RMS(cm) |
1 |
2.662 |
1.331 |
0.785 |
1.376 |
2 |
3.476 |
1.263 |
0.687 |
1.501 |
3 |
3.122 |
1.239 |
0.632 |
1.593 |
5 |
3.134 |
1.211 |
0.578 |
1.685 |
10 |
3.394 |
1.171 |
0.527 |
1.749 |
15 |
2.968 |
1.146 |
0.518 |
1.779 |
20 |
2.284 |
1.110 |
0.507 |
1.892 |
25 |
2.173 |
1.060 |
0.517 |
1.947 |
30 |
1.923 |
1.035 |
0.527 |
1.984 |
35 |
1.848 |
1.036 |
0.566 |
2.002 |
40 |
1.510 |
1.077 |
0.608 |
1.996 |
45 |
1.444 |
1.152 |
0.650 |
2.048 |
50 |
1.431 |
1.253 |
0.686 |
2.081 |
60 |
1.383 |
1.454 |
0.655 |
2.115 |
70 |
1.469 |
1.670 |
0.601 |
2.182 |
80 |
1.328 |
1.886 |
0.543 |
2.188 |
90 |
1.326 |
2.082 |
0.535 |
2.283 |
100 |
1.473 |
2.199 |
0.534 |
2.362 |
Center Traces:
CompMapVec RMS HeatMaps:
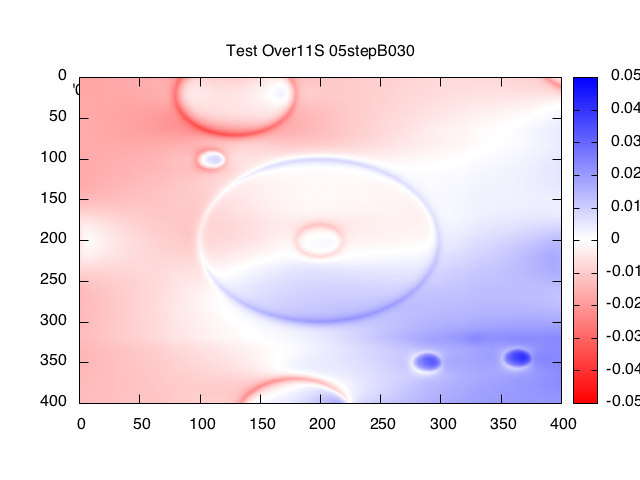
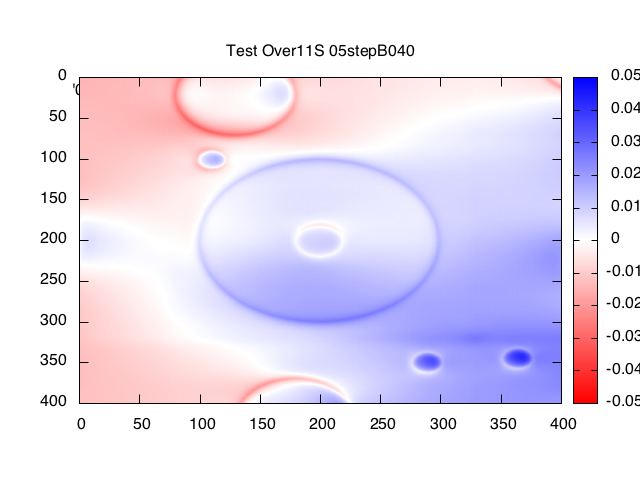
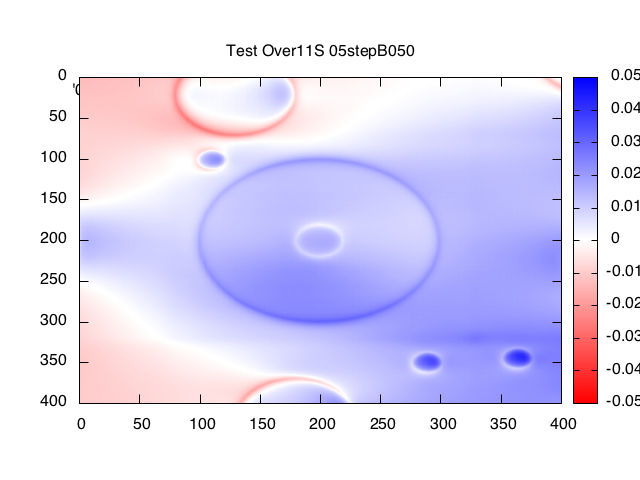
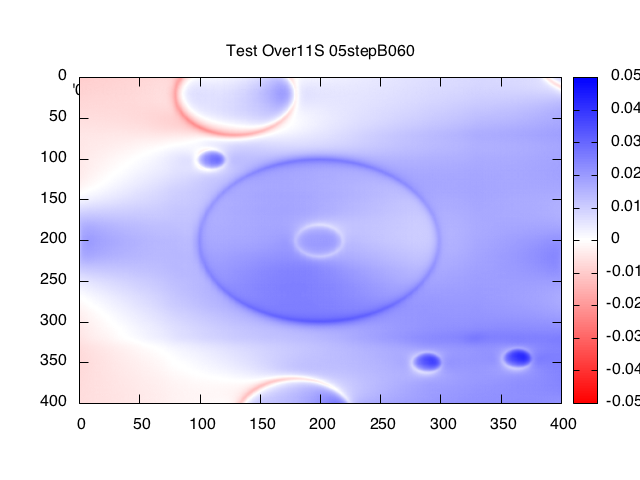
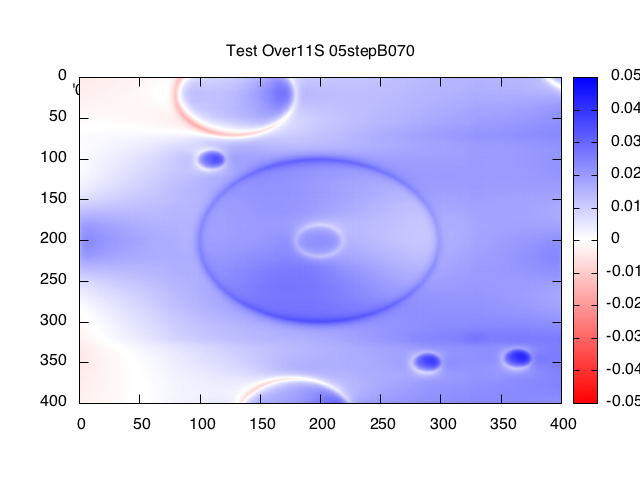
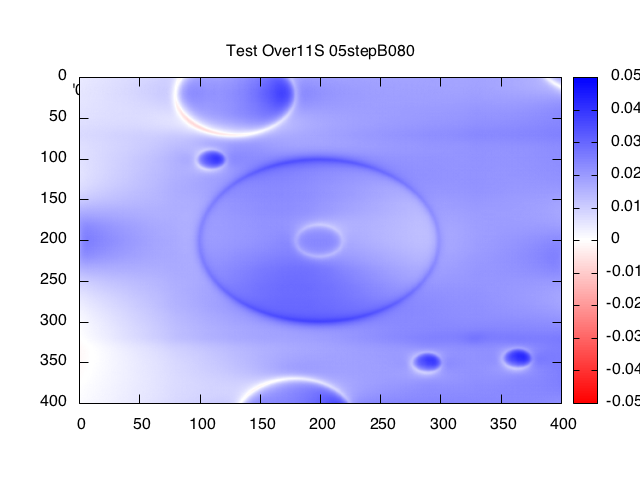
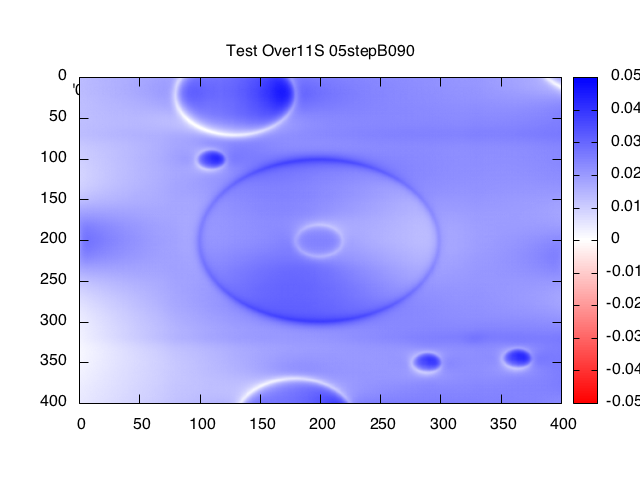
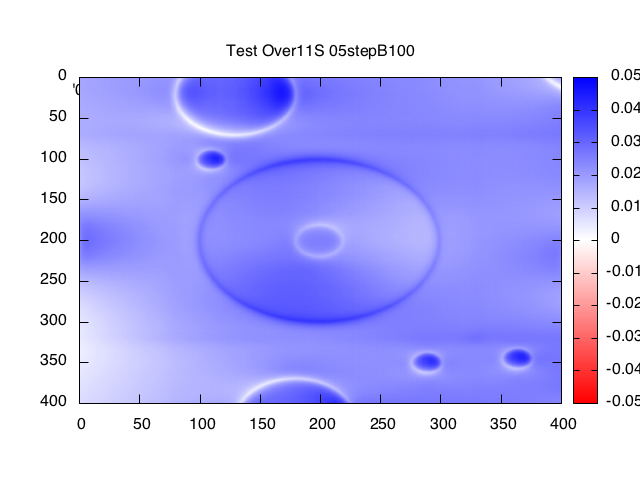
Landmark Display after 1 iteration:
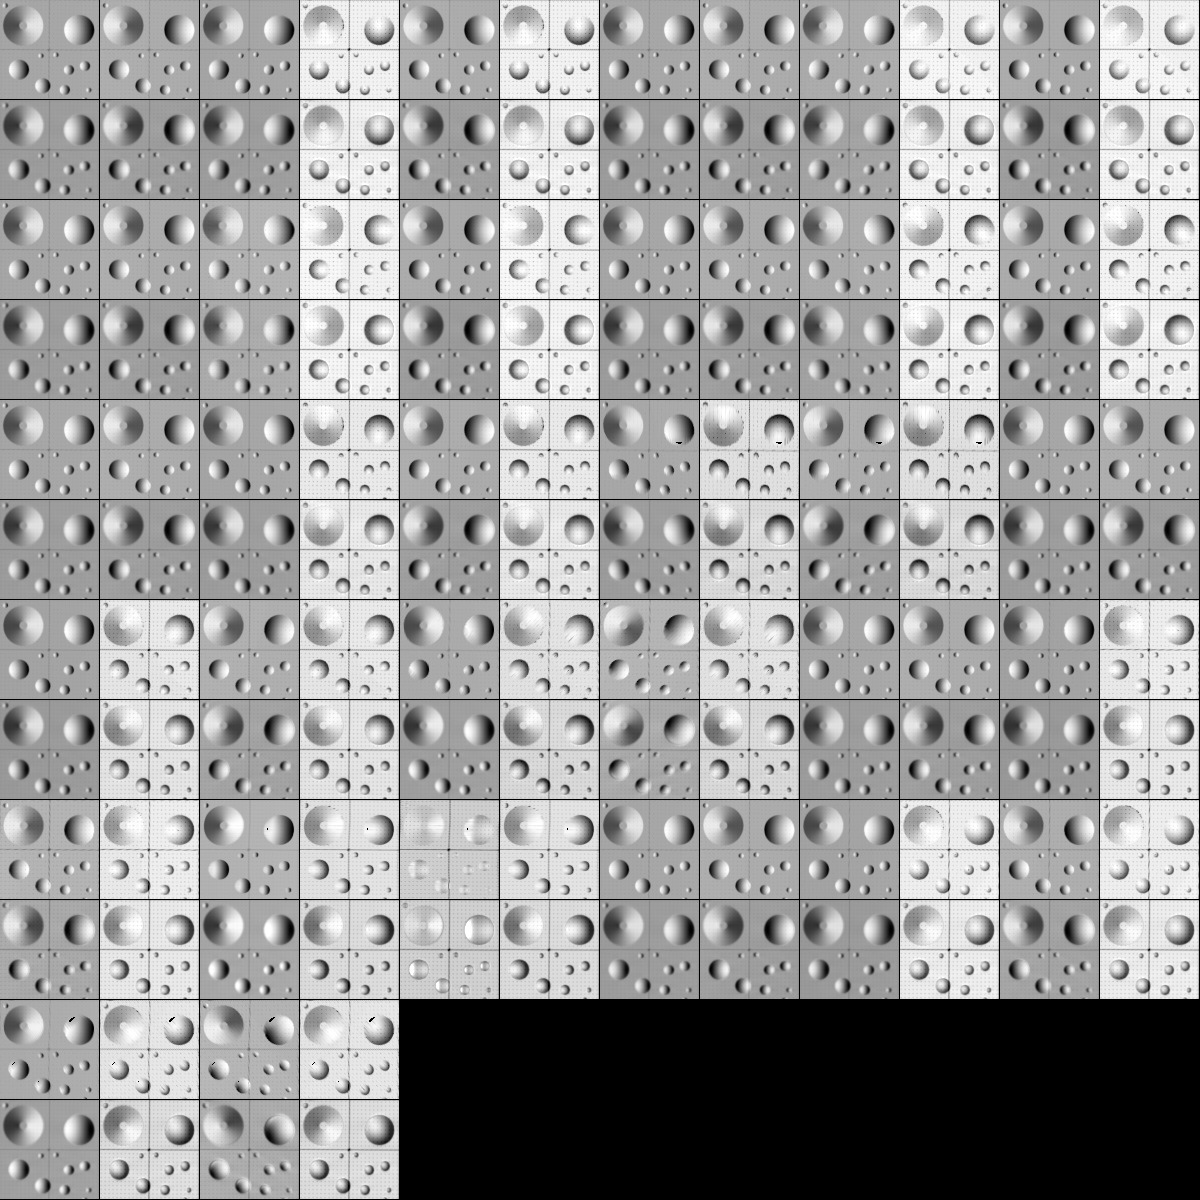
Landmark Display after 10 iterations:
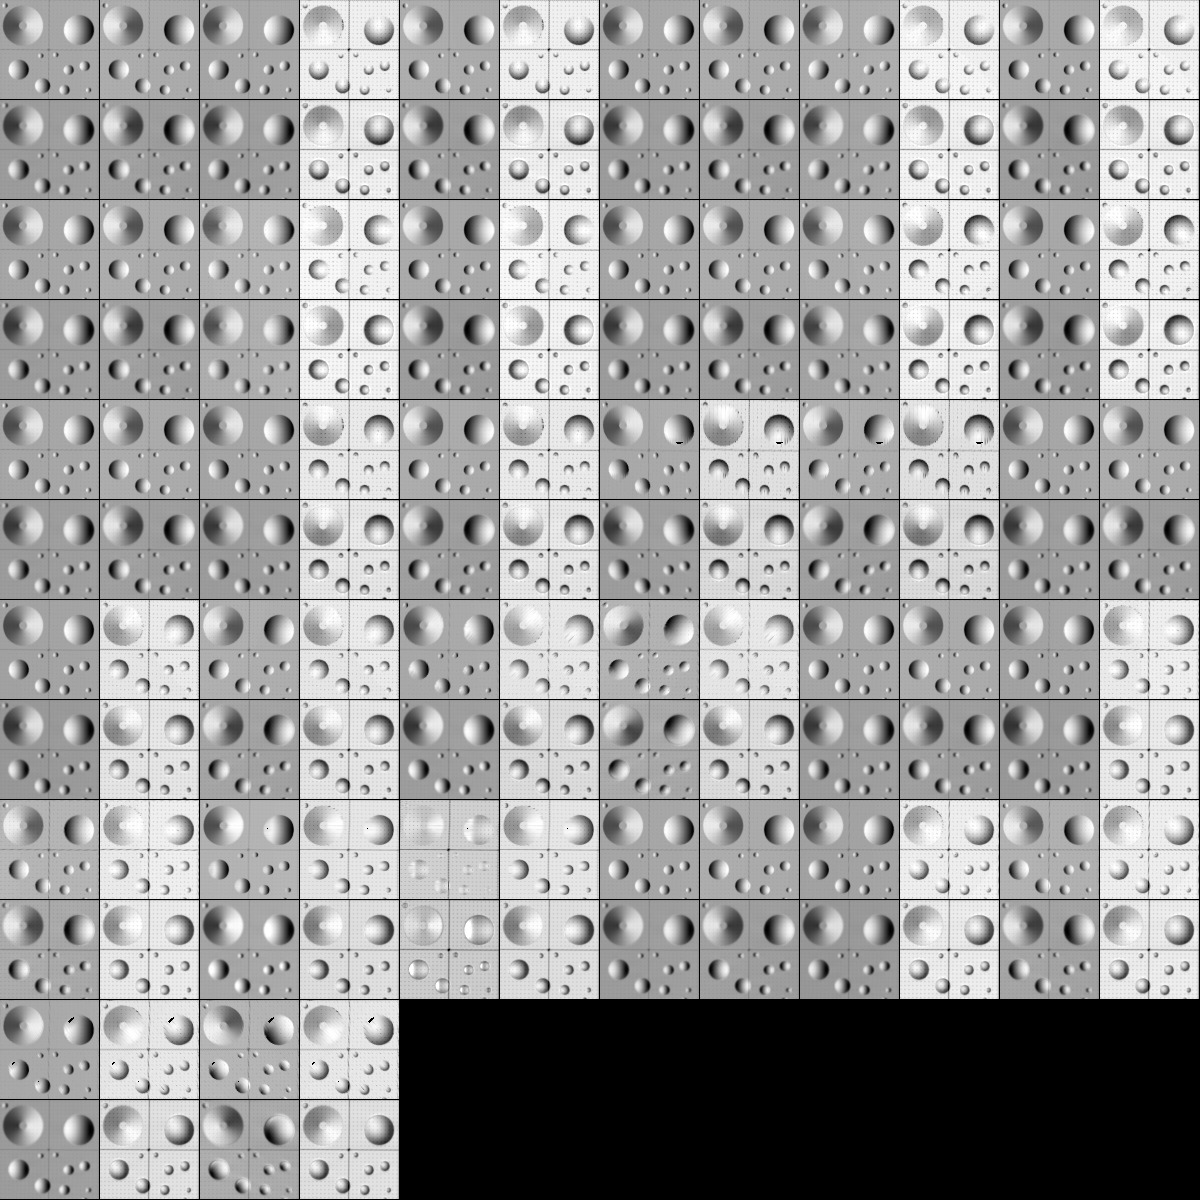
Landmark Display after 20 iterations:
