Spacecraft Zenith Variations
Aim and Objectives
Purpose of test: .
Additional Objectives
- .
Methodology
Data
- Data was generated by .
- Location and parameters for evaluation area.
- Image Suite: Image resolutions: 50cm, 20cm, 10cm, 5cm.
- emission
- .
- incidence
- .
- .
- emission
Name |
Sun |
S/C Az |
S/C Zenith |
|
Test11S |
45, 0, -45 |
every 45 |
0, 30, 60 |
|
Test11T |
45, 0, -45 |
every 45 |
0, 20, 40, 60, 80 |
|
Test11U |
45, 0, -45 |
every 45 |
0, 14, 30, 45, 60, 75 |
|
Spacecraft:
Sun:
Bigmaps
The following TAG1 bigmaps were tiled/iterated and evaluated:
Starting topography defined from: ?
Step |
GSD |
Overlap Ratio |
Q Size |
Width |
35cm-Tiling |
||||
18cm-Tiling |
||||
9cm-Tiling |
||||
5cm-Tiling |
Iteration Parameters
Reset albedo/slopes: ?YES
Calculate Central Vector: ?YES
Differential Stereo: ?YES
Shadows: ?NO
Results
Discussion
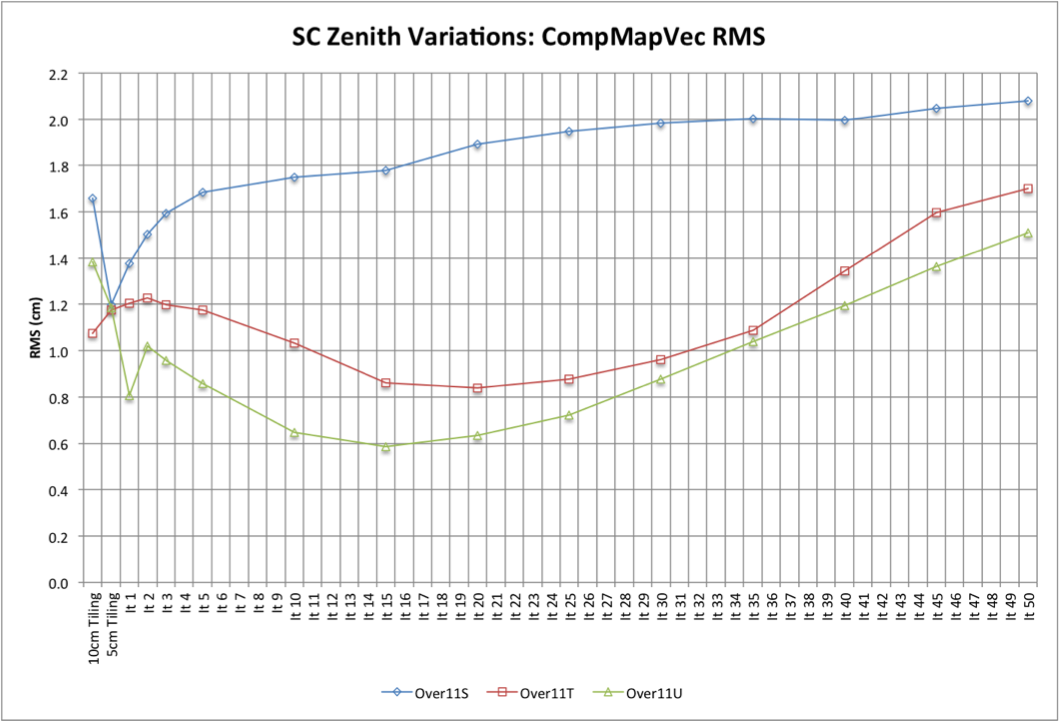
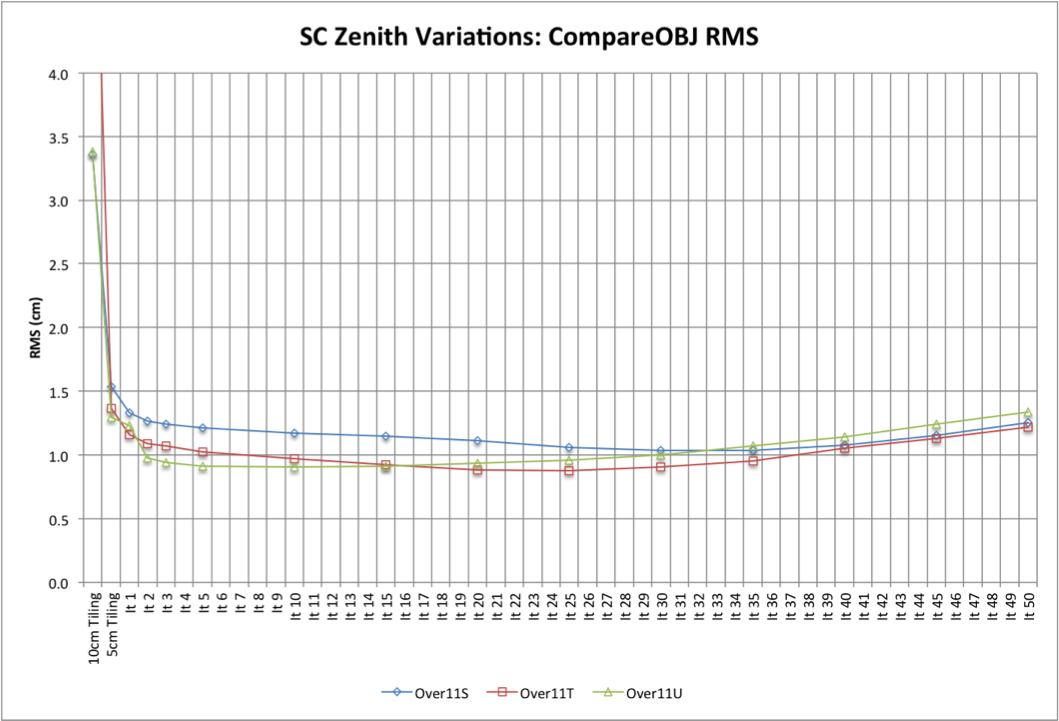
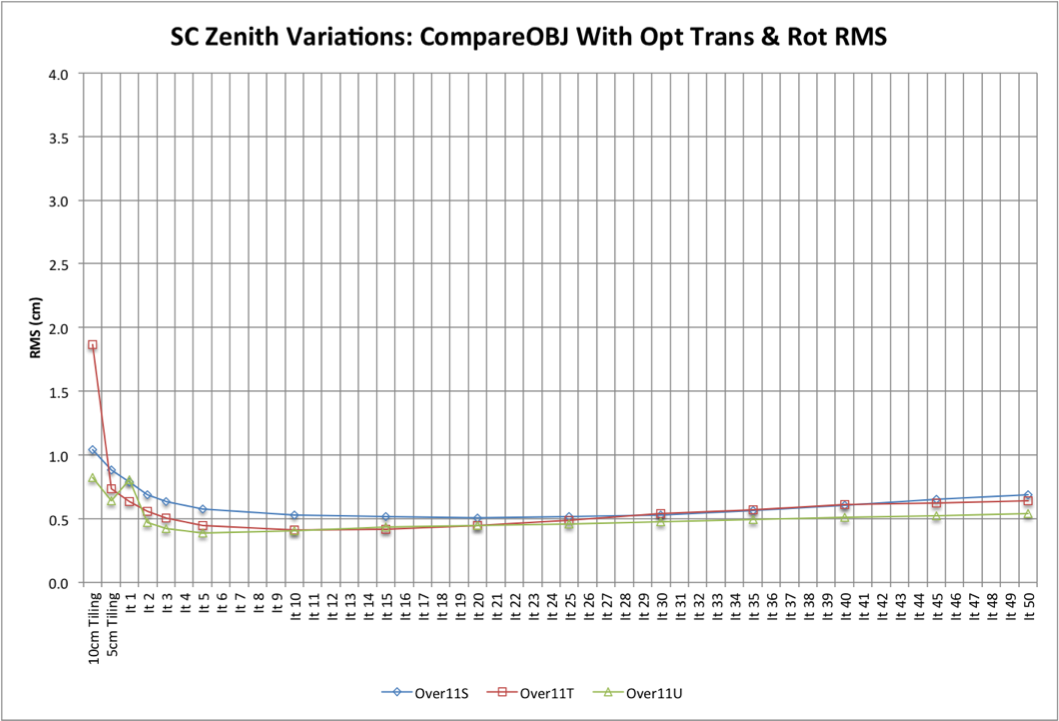
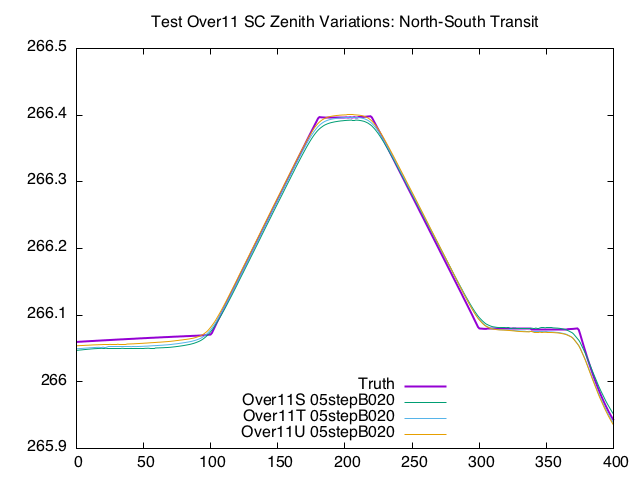
The measures of accuracy are plotted for each test in figures ?? to ?? under Tables and Figures (below).
Figure 1: Minima
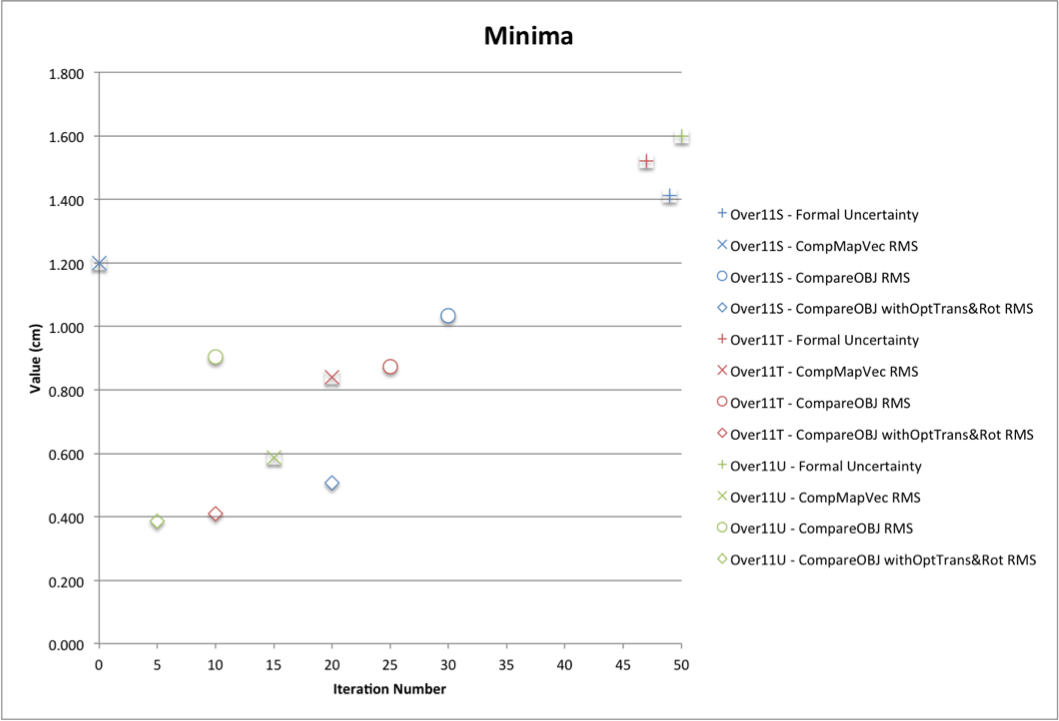
Figure 1 illustrates the minimum uncertainty and RMSs for each test, and at which iteration each minimum occurs. The following patterns are apparent:
Test U achieves the minimum value for every measure in the least number of iterations: 5 to 15 iterations sooner than Test T; and 15 to 20 iterations sooner than Test S (excluding Test S - CompMapVec RMS).
- Test S consistently gives the largest RMS but the smallest formal uncertainty.
- CompareOBJ RMS (with and without optimal translation and rotation varies across tests by less than 0.2cm, although Test U consistently archives the minimum RMS in significantly fewer iterations.
Tables and Figures
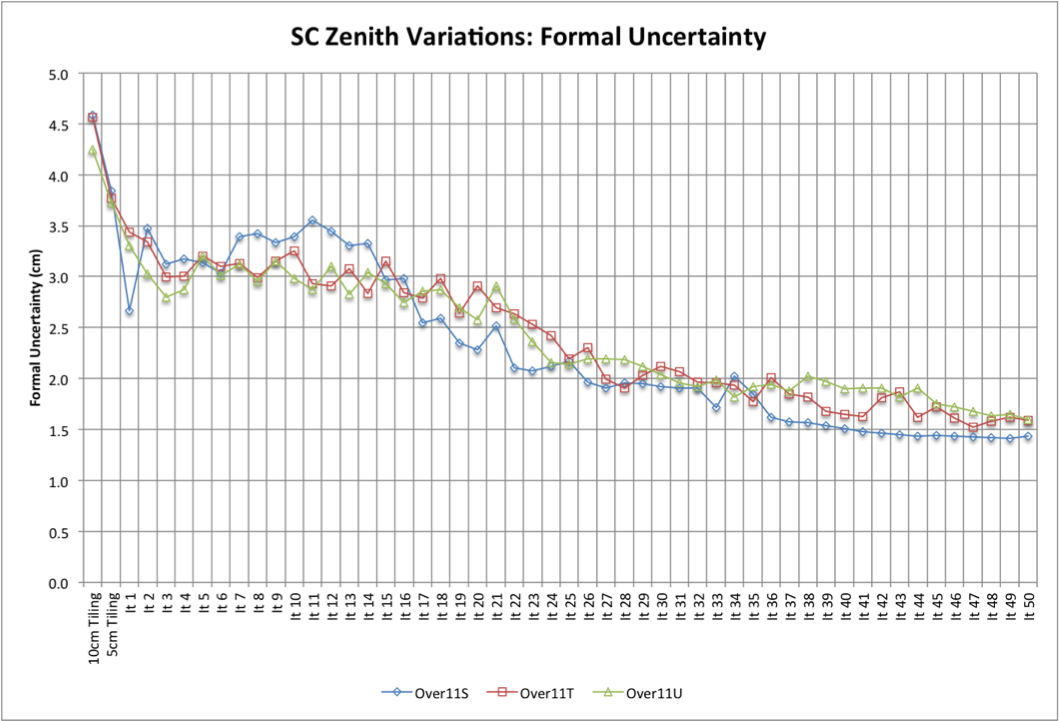
Formal Uncertainty
CompMapVec RMS
CompareOBJ RMS
CompareOBJ With Opt Tran & Rot
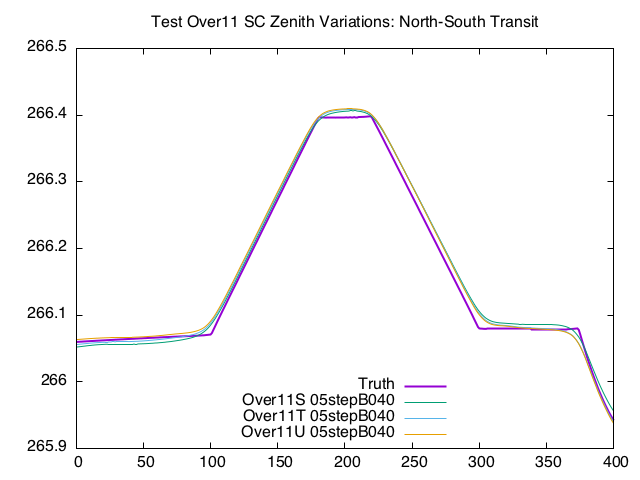
Traces Running North_South
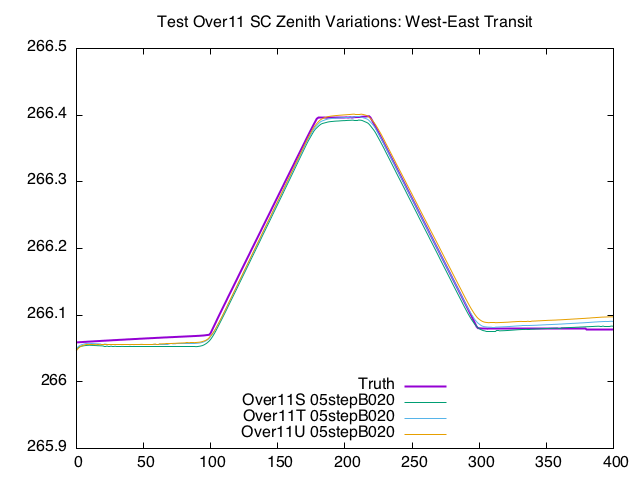
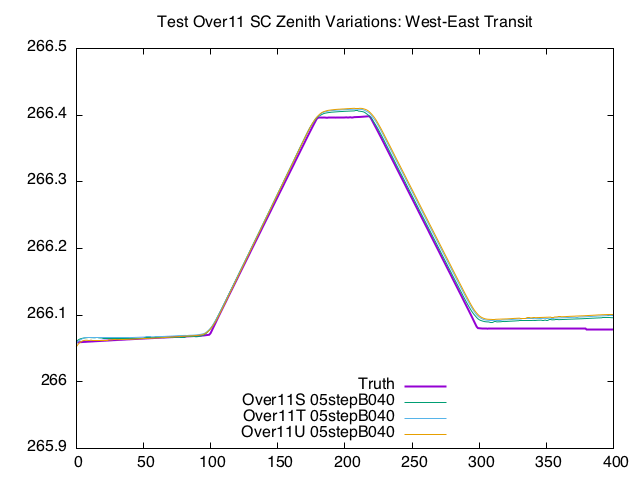
Traces Running West-East
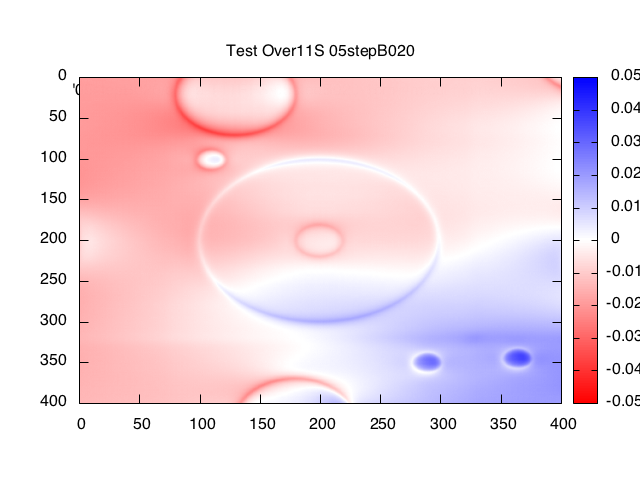
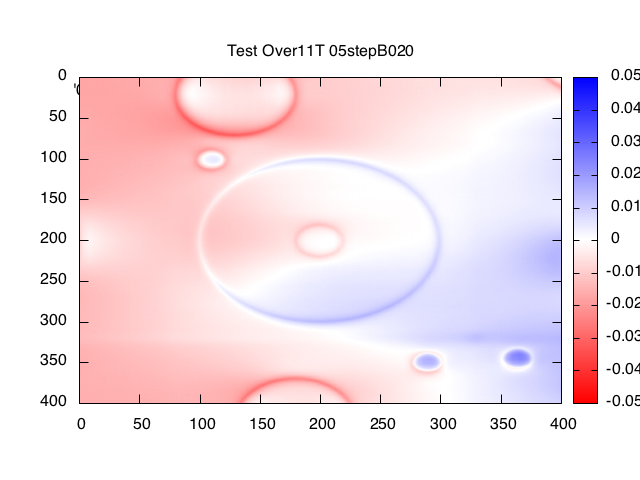
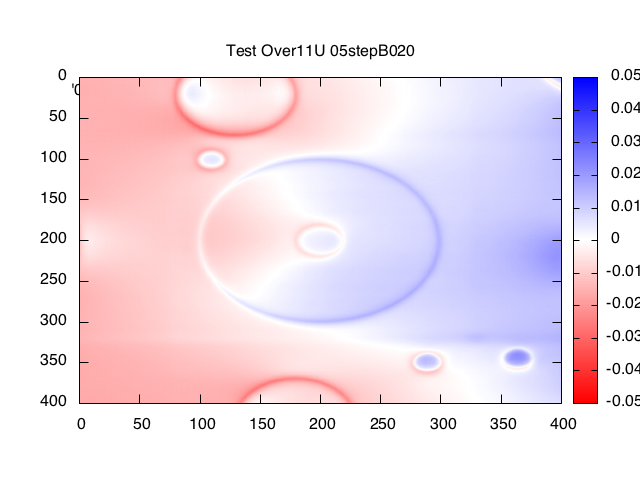
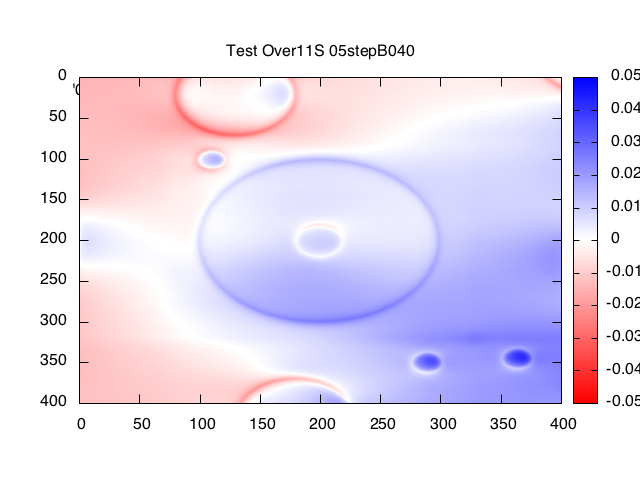
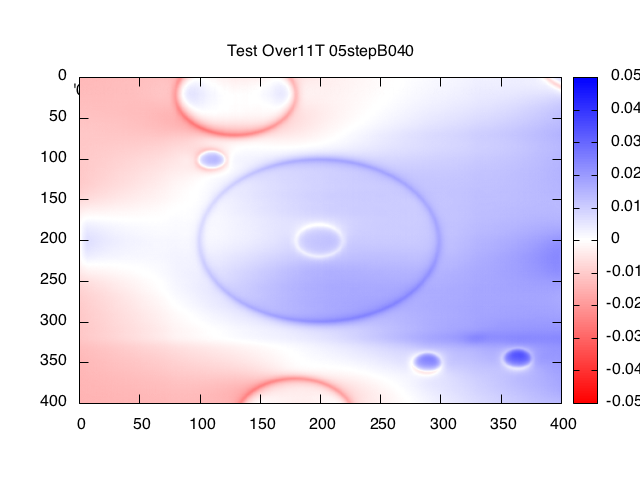
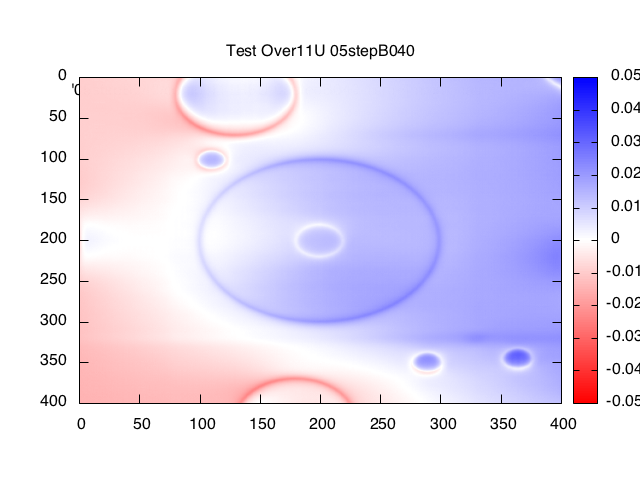
Heat Plots
