Test 11 Version I
The page contains the results of Test 11 version I. Essentially, version I tested the performance of the SPC software when pictures centered on a con with its top cut up were taken at spacecraft azimuth's varying every 60 degrees. The Goal of this test along with the other versions of Test 11, were to see how picture info affects SPC's ability and speed in replicating a 20 degree slope.
Results & Conclusions
Stats
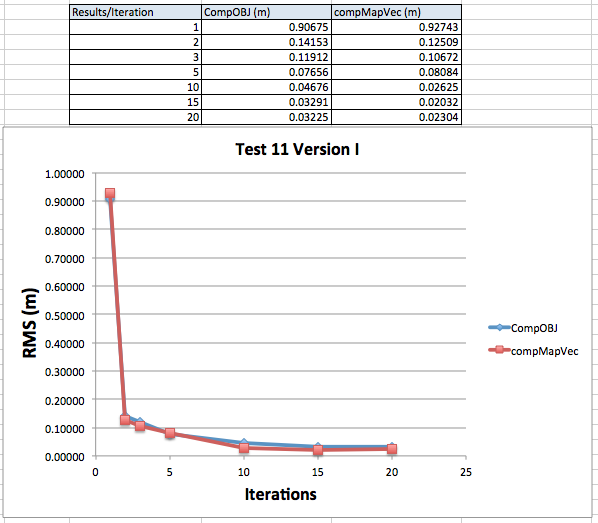
These stats show the RMS calculated by compMapVec and CompareOBJ at various SPC iterations. From the graph it appears the RMS stabilizes somewhere between 15 and 20 iterations. Also, the RMS after the first iteration is really high (as is proved in iteration 1's trace), but quickly comes down as more iterations are performed.
Traces
Iteration 1^ 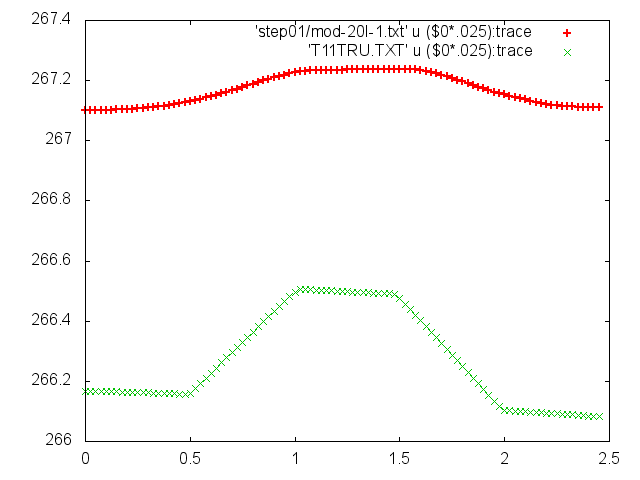
Iteration 2^ 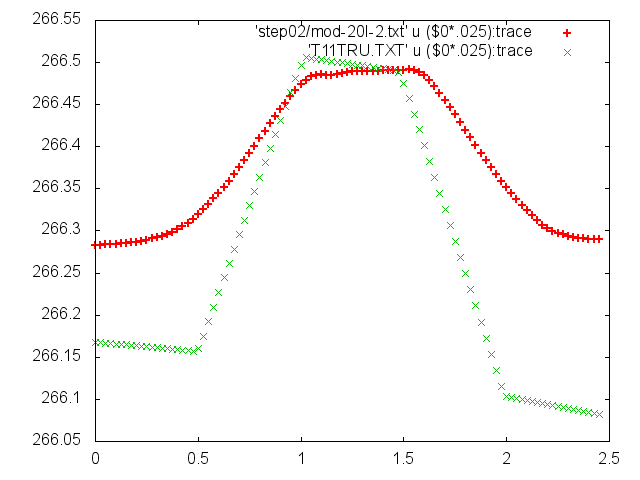
Iteration 3^ 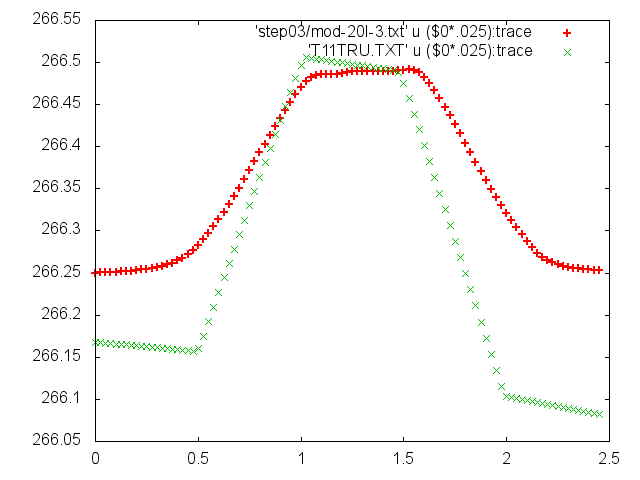
Iteration 5^ 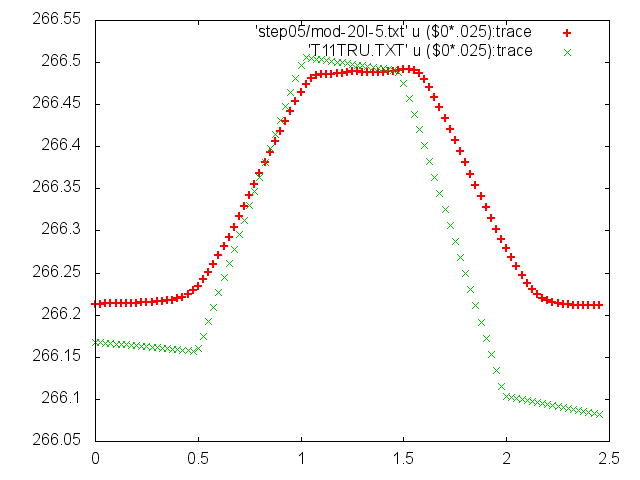
Iteration 10^ 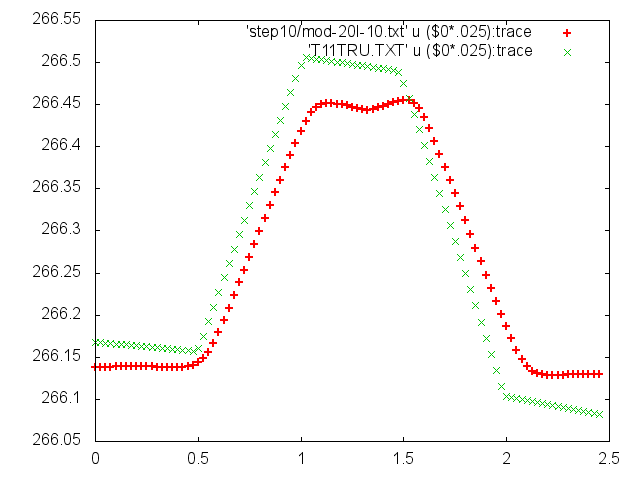
Iteration 15^ 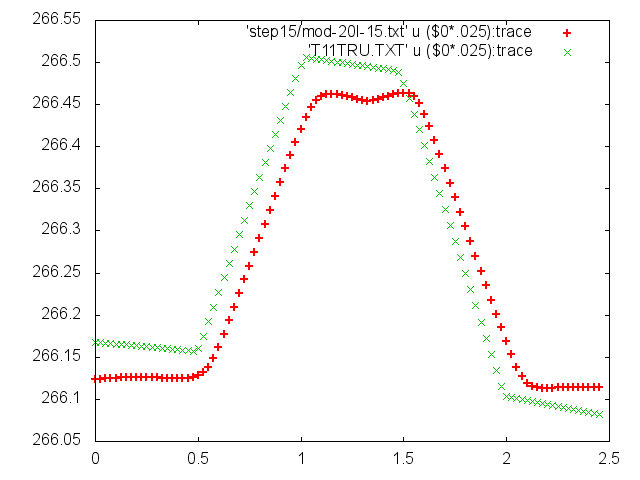
Iteration 20^ 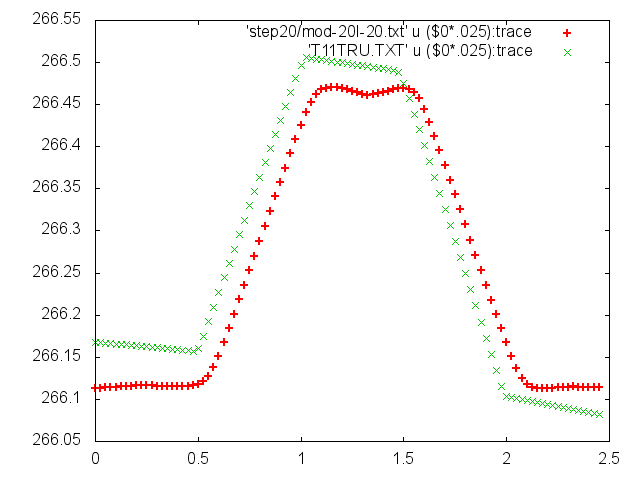
By observing the traces, the slope of the shape model seems to match the truth once 10 iterations are performed. However, once the slopes match, it looks like the center top of the shape model trace represents a concave function. This matches John Weirichs SPC's handling of boulder research. Also, I believe that the reason why the base of the shape models cone does not match the height of the truth's is because of the maplet tilt (Idon't remember how this tilt was introduced, but Eric knows).
One more thing worth mentioning is that you can really see the smoothing introduced by SPC where the top of the cut off cone trace and base of the cut off cone traces begins/ends.
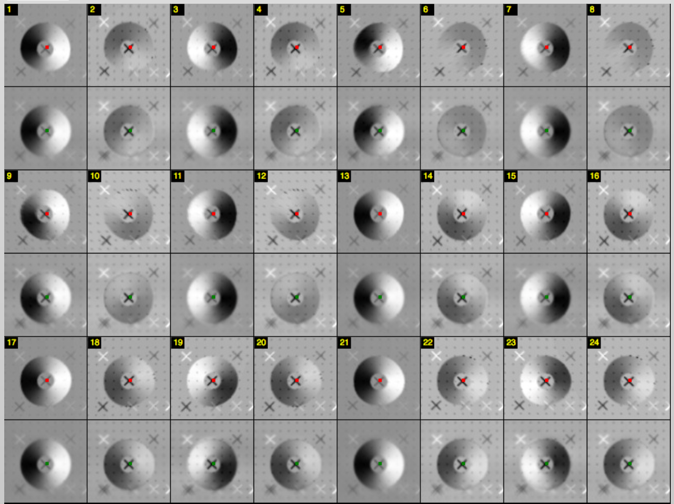
Landmark Pictures
Iteration 20:
I didn't save LMRK pics at previous iterations. The point of this picture is to show how the template looks compared to the truth at the last iteration. 