TestF3G - Navigation Error Sensitivity Test Results
Definitions
CompareOBJ RMS: |
The root mean square of the distance from each bigmap pixel/line location to the nearest facet of the truth OBJ. |
PTG: |
The formal camera pointing uncertainty. |
SCOBJ: |
The S/C position vector from the center of the asteroid. |
VSO: |
The formal SCOBJ uncertainty. |
Additional Tests
S/C Position and Camera Pointing Uncertainties
The Detailed Survey PolyCam F3G data set had large S/C position and pointing uncertainties, unsuitable for Detailed Survey Baseball Diamond trajectories:
- VSO = 1km;
- PTG = 1mrad.
An additional suite of tests was therefore run with a duplicate Detailed Survey PolyCam dataset with S/C position and pointing uncertainties set to one-sigma:
- VSO = 6.4m;
- PTG = 0.217mrad.
Results for both data sets are presented herein.
Model Center-of-Body Shift
In the process of generating the 35cm Preliminary Shape Model, a shift in the body center with respect to the inertial center was applied. The magnitude of the shift was approximately 2m. Since the final S/C position across F3G subtests lay in a region 2m to 8m from the true S/C position, the effect of the body center shift came into question. To investigate, an alternative 35cm Preliminary Shape Model with no body-center shift was generated. One subtest was re-run using the alternative start model.
Key Findings
CompareOBJ RMSs (with and without translation/rotation) show no trend with the magnitude of S/C position and camera pointing perturbation within the perturbation ranges tested. The correlation score also does not vary with the magnitude of S/C position and camera pointing perturbation and is approx. 0.76 giving a very good indication of correlation. The accuracy of the evaluation model is therefore invariant to the S/C position or camera pointing perturbation up to three standard deviations.
The results show no significant difference in the final S/C position (SCOBJ) with respect to the magnitude of S/C position and camera pointing perturbation within the ranges tested, indicating that the SPC-driven S/C position modeling is immune to S/C position and pointing perturbation up to three standard deviations.
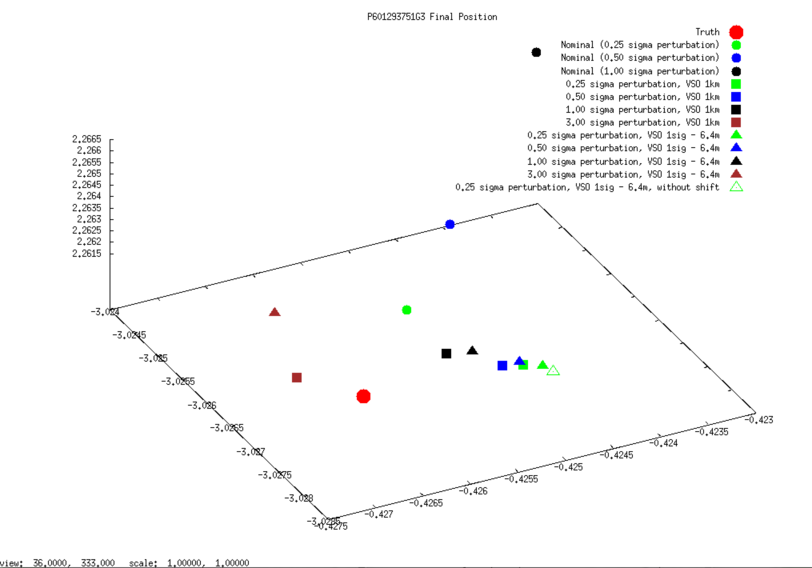
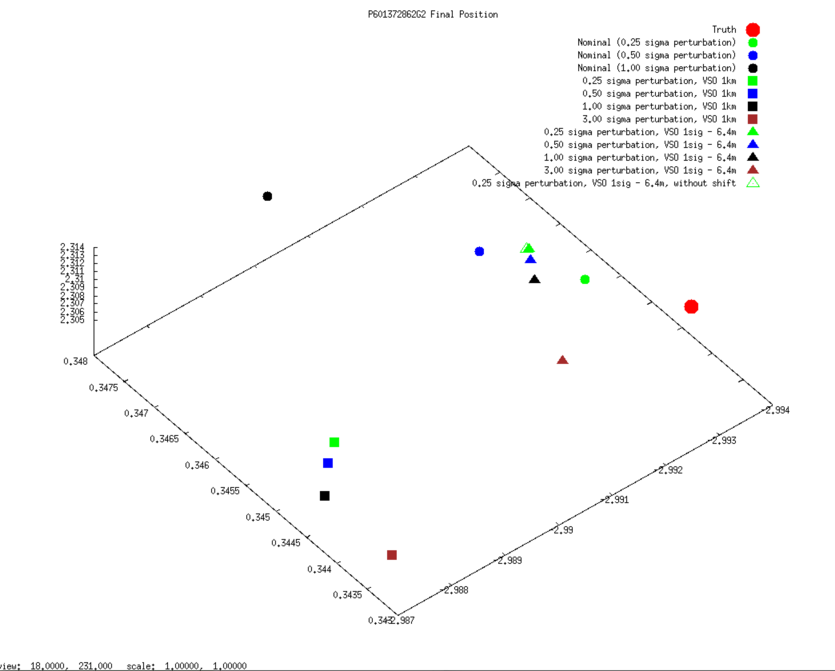
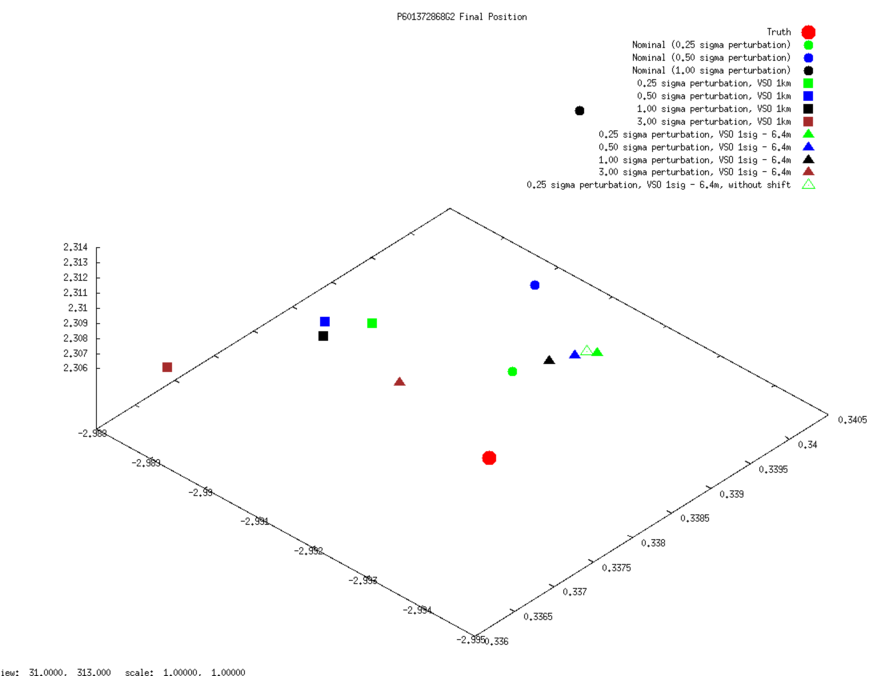
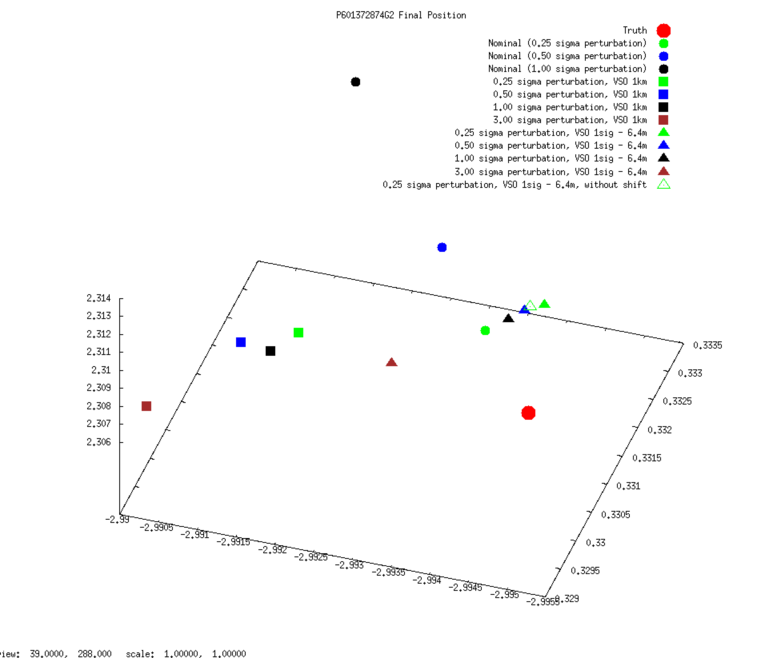
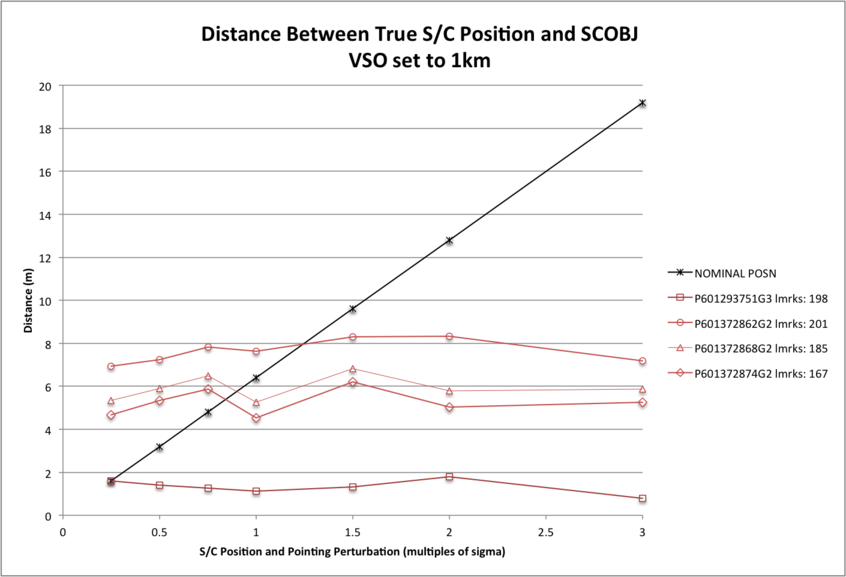
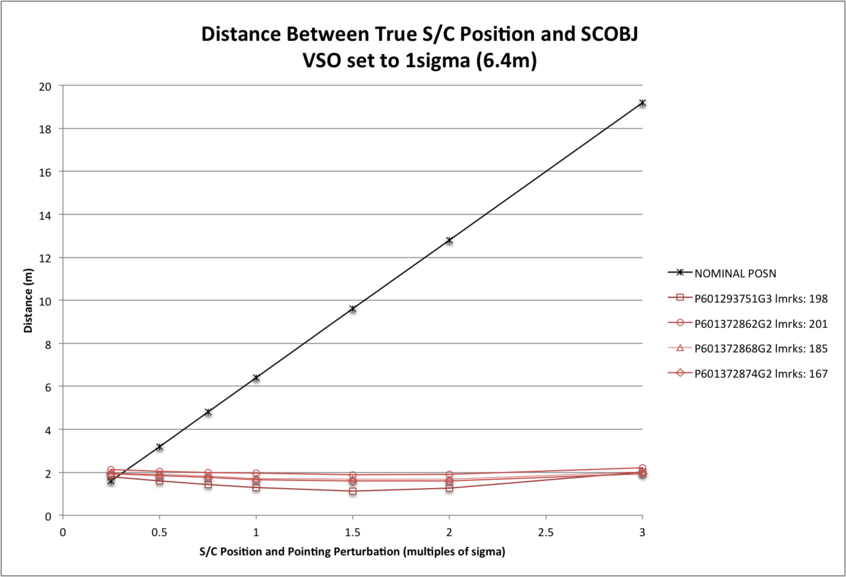
With the large S/C position and camera pointing uncertainties, the final SPC-derived S/C position is within 8m of the true S/C position, and in two cases is within 2m of the true S/C position. With the reduced (1 sigma) S/C position and camera pointing uncertainties, all the final SPC-derived S/C positions are within 2m of the true S/C position. The distance between the final S/C position and the true S/C position is not dependent on the initial perturbed S/C position - indeed, in the 0.25 x sigma case, the SPC-derived S/C position in most cases moves further away from the true S/C position (final distance from truth: 1.6m to 6.9m) than its initial position (initial distance from truth: 1.6m).
The final SPC-derived S/C positions appear to be clustered around an incorrect solution 2m distant from the true S/C position (in the VSO=1sigma tests). This distance appears to correspond with a shift in the center-of-body which was applied during the generation of the 35cm Preliminary Survey Start Model. However, this finding persisted when a subtest was re-run with a 35cm Preliminary Survey Start Model which had not had a shift applied to the center-of-body. Measures of both model accuracy and S/C position did not vary with center-of-body shift.
Important Notes
It should be noted that S/C position perturbation was divided equally between the SCOBJ components, resulting in a distance from the truth position which was a multiple of the standard deviation of 6.4m. Therefore:
- maximum lateral perturbation was a multiple of 3.7m (6.4m/sqrt(3));
- maximum normal perturbation (wrt body center) was a multiple of 3.7m (6.4m/sqrt(3)).
It is assumed that the worst case scenario is a 3 x sigma (19.2m) lateral perturbation. The maximum possible lateral perturbation tested was 3 x 3.7m = 11.1m.
Results and Discussion
CompareOBJ RMS
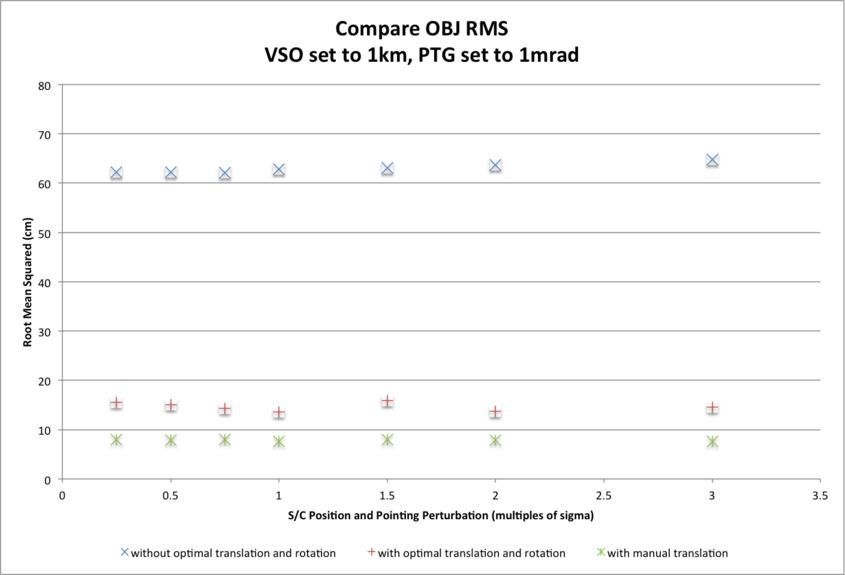
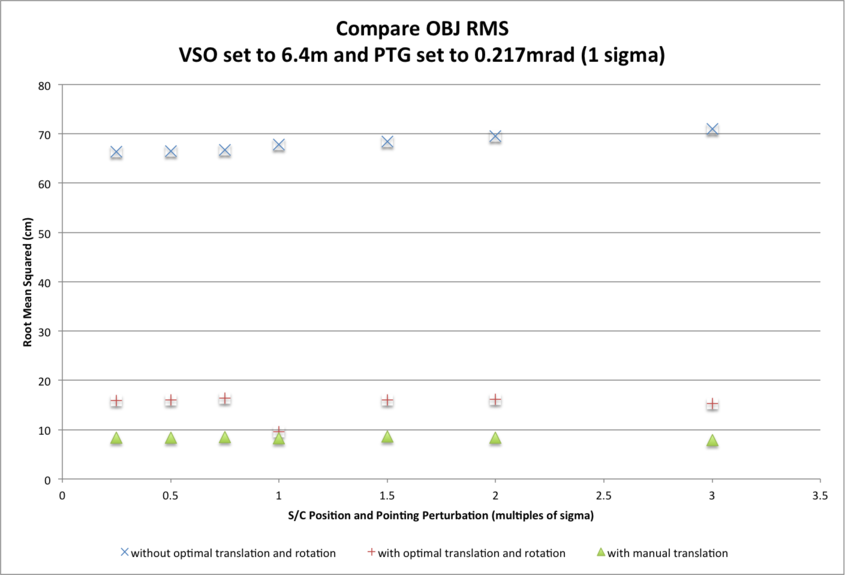
Three CompareOBJ RMS values for the final 5cm resolution 20m x 20m evaluation bigmap are presented for each subtest and each S/C position and camera pointing uncertainty:
- The largest CompareOBJ RMS (approx. 65cm across subtests) is obtained by running CompareOBJ on the untranslated and unrotated evaluation model.
- The second smallest CompareOBJ RMS (approx. 15cm across subtests) is obtained by running CompareOBJ with its optimal translation and rotation option.
- The smallest CompareOBJ RMS (approx. 9cm across subtests) is obtained by manually translating the evaluation model and searching for a local CompareOBJ RMS minimum.
The CompareOBJ optimal translation routine is not optimized for the evaluation model scale (5cm pix/line resolution). Manual translations of the bigmap were therefore conducted in an attempt to find a minimum CompareOBJ RMS. The manually translated evaluation models gave the smallest CompareOBJ RMSs.
CompareOBJ RMSs do not show a trend with the magnitude of S/C position and pointing perturbation within the ranges tested.
CompareOBJ RMSs differ slightly with S/C position and camera pointing uncertainties, with smaller RMS values corresponding with lower uncertainties:
- approx. 5cm difference for CompareOBJ RMS without translation/rotation;
- approx. 2cm difference for CompareOBJ RMS with optimal translation and rotation;
- approx. 0.4cm difference for CompareOBJ RMS with manual translation.
CompareOBJ Optimal Translations:
Sub-Test |
S/C Position Uncertainty |
Perturbation Magnitude |
RMS (cm) |
Translation (cm) |
Translated Distance (cm) |
||
1km |
0.25 x sigma |
15.7849 |
85.0698 |
62.3596 |
-14.3765 |
106.4532 |
|
1km |
0.50 x sigma |
15.1147 |
84.5538 |
61.6624 |
-15.3434 |
105.7687 |
|
1km |
0.75 x sigma |
14.3150 |
95.8438 |
59.9313 |
-21.6901 |
115.1011 |
|
1km |
1.00 x sigma |
13.6399 |
106.4870 |
58.2162 |
-27.3527 |
124.4057 |
|
1km |
1.50 x sigma |
15.8949 |
79.1224 |
63.2865 |
-19.6432 |
103.2056 |
|
1km |
2.00 x sigma |
13.6938 |
110.1339 |
58.9454 |
-23.2403 |
127.0596 |
|
1km |
3.00 x sigma |
14.6271 |
93.5937 |
61.6997 |
-26.8422 |
115.2698 |
|
Sub-Test |
S/C Position Uncertainty |
Perturbation Magnitude |
RMS (cm) |
Translation (cm) |
Translated Distance (cm) |
||
6.4m |
0.25 x sigma |
15.9614 |
95.5555 |
66.8688 |
-17.6793 |
117.9613 |
|
6.4m |
0.50 x sigma |
16.0260 |
93.7254 |
66.9687 |
-17.2331 |
116.4743 |
|
6.4m |
0.75 x sigma |
16.4387 |
88.3626 |
69.0785 |
-12.1628 |
112.8172 |
|
6.4m |
1.00 x sigma |
9.5449 |
167.5406 |
57.3951 |
-27.0780 |
179.1571 |
|
6.4m |
1.50 x sigma |
16.0525 |
93.4737 |
70.0956 |
-15.0998 |
117.808=1 |
|
6.4m |
2.00 x sigma |
16.1591 |
94.1139 |
69.1165 |
-19.95051 |
118.4514 |
|
6.4m |
3.00 x sigma |
15.2938 |
101.8134 |
70.3467 |
-20.3179 |
125.4091 |
|
CompareOBJ Manual Translations:
Sub-Test |
S/C Position Uncertainty |
Perturbation Magnitude |
RMS (cm) |
Translation (cm) |
Translated Distance (cm) |
||
1km |
0.25 x sigma |
8.0140 |
187.5 |
47.5 |
-30 |
195.74 |
|
1km |
0.50 x sigma |
7.9343 |
187.5 |
47.5 |
-30 |
195.74 |
|
1km |
0.75 x sigma |
7.9579 |
187.5 |
47.5 |
-30 |
195.74 |
|
1km |
1.00 x sigma |
7.6749 |
187.5 |
47.5 |
-30 |
195.74 |
|
1km |
1.50 x sigma |
7.9964 |
187.5 |
47.5 |
-40 |
197.52 |
|
1km |
2.00 x sigma |
7.8591 |
187.5 |
47.5 |
-40 |
197.52 |
|
1km |
3.00 x sigma |
7.6739 |
187.5 |
47.5 |
-50 |
209.19 |
|
Sub-Test |
S/C Position Uncertainty |
Perturbation Magnitude |
RMS (cm) |
Translation (cm) |
Translated Distance (cm) |
||
6.4m |
0.25 x sigma |
8.4097 |
207.5 |
47.5 |
-30 |
214.9709 |
|
6.4m |
0.50 x sigma |
8.3974 |
207.5 |
47.5 |
-30 |
214.9709 |
|
6.4m |
0.75 x sigma |
8.5008 |
207.5 |
47.5 |
-30 |
214.9709 |
|
6.4m |
1.00 x sigma |
8.2400 |
207.5 |
47.5 |
-40 |
216.5929 |
|
6.4m |
1.50 x sigma |
8.5820 |
197.5 |
57.5 |
-20 |
206.6700 |
|
6.4m |
2.00 x sigma |
8.4134 |
197.5 |
57.5 |
-30 |
207.8762 |
|
6.4m |
3.00 x sigma |
7.9259 |
197.5 |
57.5 |
-30 |
207.8762 |
|
Normalized Cross Correlation Scores
The evaluation maps were compared with a truth map via a cross-correlation routine which derives a correlation score. As a guide the following scores show perfect and excellent correlations:
- A map cross-correlated with itself will give a correlation score of approx. 1.0;
- Different sized maps sampled from the same truth (for example a 1,100 x 1,100 5cm sample map and a 1,000 x 1,000 5cm sample map) give a correlation score of approx. 0.8.
The correlation scores show no trend with S/C position and camera pointing perturbation in the perturbation-range tested. The correlation scores also do not differ with S/C position and camera pointing uncertainties. The correlation score across subtests is approx. 0.76 giving a very good indication of correlation.
Correlation Scores:
Sub-Test |
S/C Position Uncertainty |
Perturbation Magnitude |
Correlation Score |
1km |
0.25 x sigma |
0.7619 |
|
1km |
0.50 x sigma |
0.7625 |
|
1km |
0.75 x sigma |
0.7617 |
|
1km |
1.00 x sigma |
0.7641 |
|
1km |
1.50 x sigma |
0.7684 |
|
1km |
2.00 x sigma |
0.7537 |
|
1km |
3.00 x sigma |
0.7679 |
Sub-Test |
S/C Position Uncertainty |
Perturbation Magnitude |
Correlation Score |
6.4m |
0.25 x sigma |
0.7628 |
|
6.4m |
0.50 x sigma |
0.7633 |
|
6.4m |
0.75 x sigma |
0.7637 |
|
6.4m |
1.00 x sigma |
0.7672 |
|
6.4m |
1.50 x sigma |
0.7606 |
|
6.4m |
2.00 x sigma |
0.7510 |
|
6.4m |
3.00 x sigma |
0.7683 |
Image Footprints
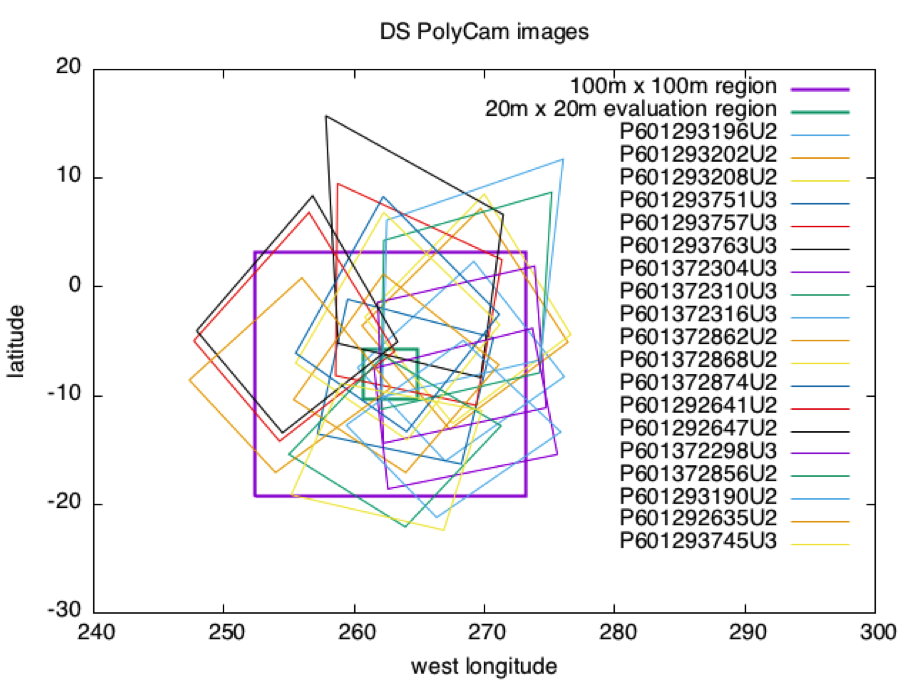
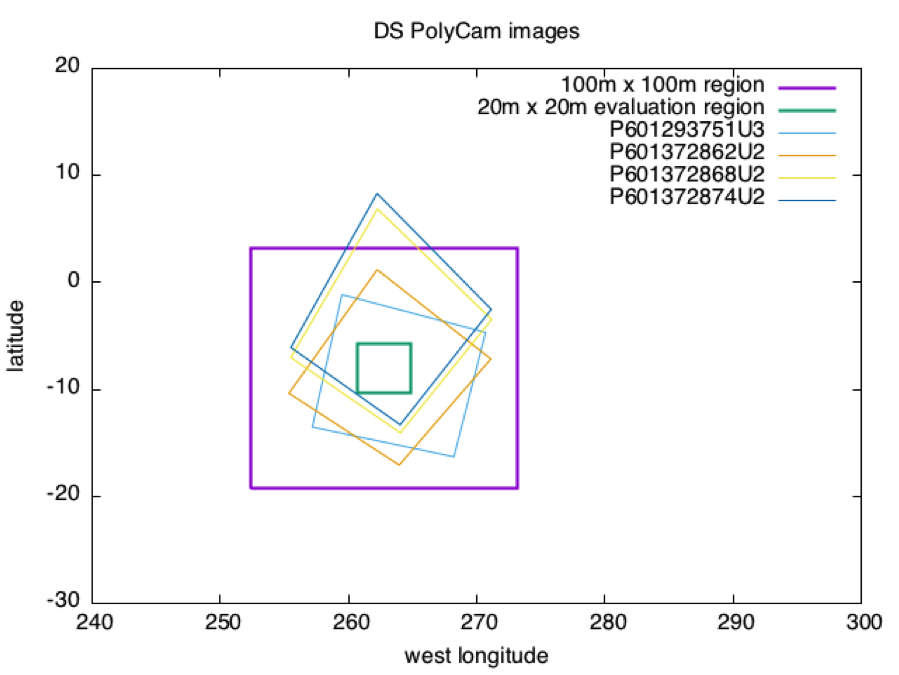
The first graph shows footprints for all Detailed Survey PolyCam pictures which were included in the model. The second graph shows the four pictures down-selected for S/C position evaluation purposes due to their coverage of the 20m x 20m evaluation region, and their almost complete containment within the iterated 100m x 100m region.
Distance SCOBJ(truth) to SCOBJ(solution)
The distance of the final SPC-derived S/C position from the true S/C position is plotted for the evaluation Detailed Survey PolyCam image set for each magnitude of perturbation. The distance of the final SCOBJ from the true S/C position is invariant with the perturbation to the initial SCOBJ within the perturbation-range tested. The range of distances across pictures does vary with S/C position uncertainty however, with:
- distances ranging from approx. 1m to 8m with VSO=1km;
- distances ranging from approx. 1m to 2m with VSO=6.4m (1 sigma).
SCOBJ
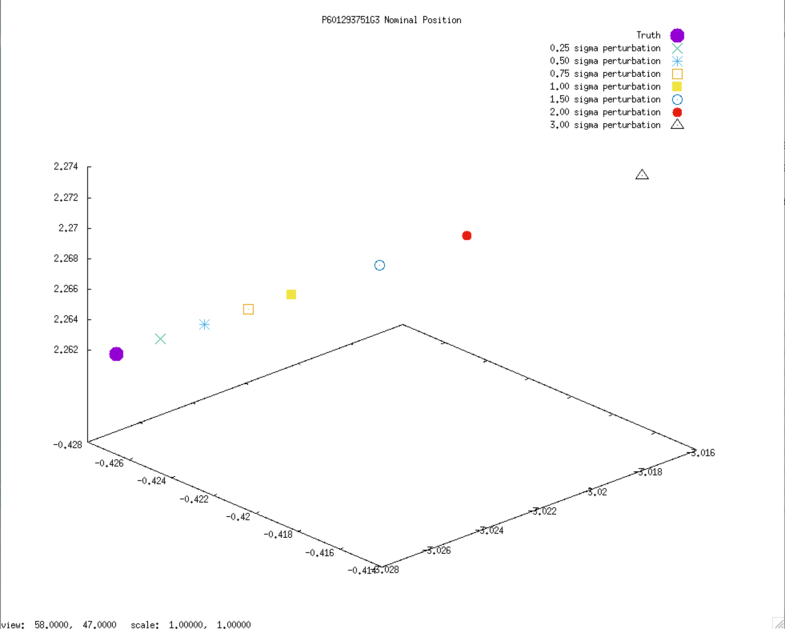
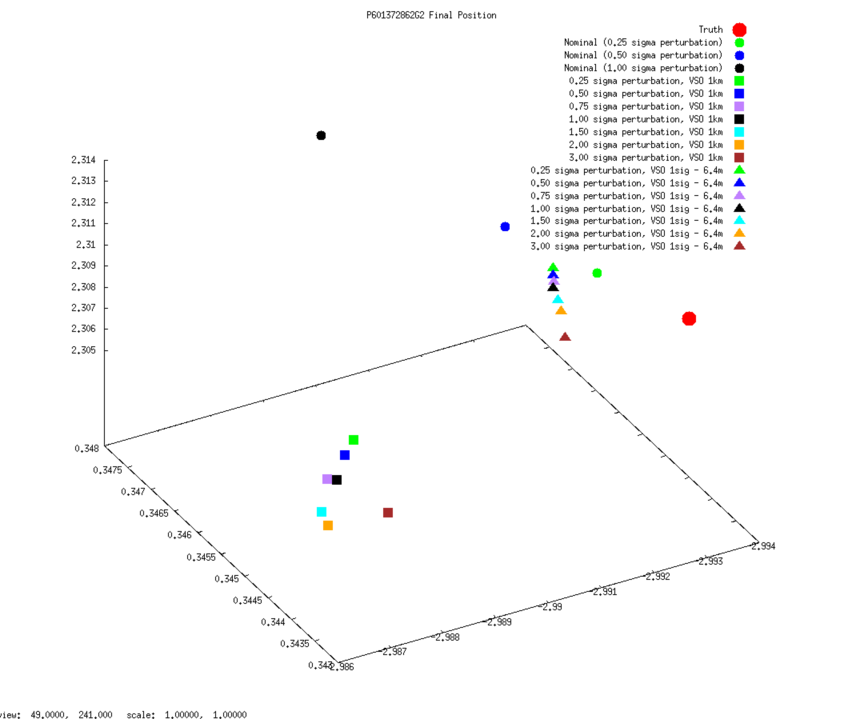
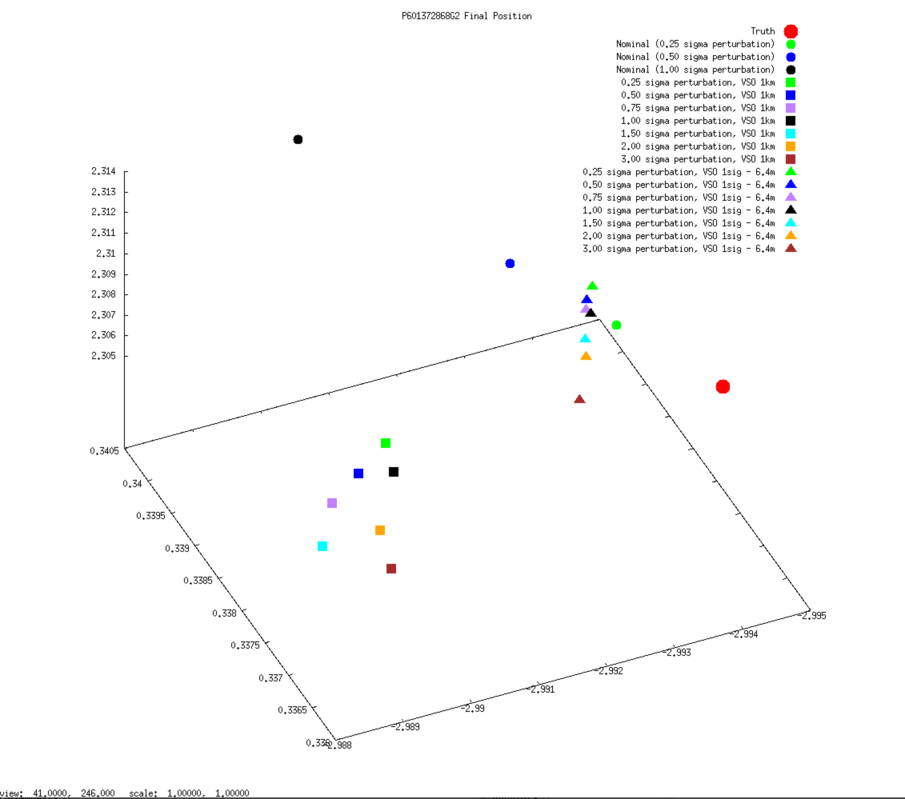
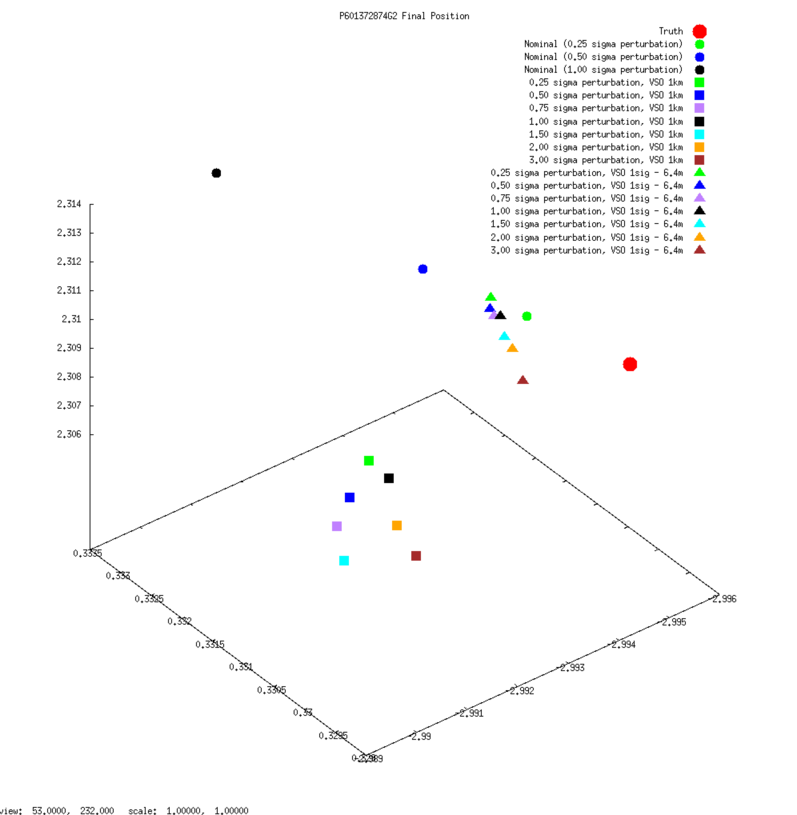
3D graphs of final SPC-derived SCOBJ and true SCOBJ are plotted for each evaluation picture.
The pattern of final SPC-derived SCOBJ is broadly consistent across magnitudes of initial S/C position perturbation. The position correction is mostly a normal correction with lateral movement, bringing the modeled S/C position within approx. 2m to 8m of the true S/C position. Note that the SCOBJs form a cluster which is offset from the truth indicating that the model is converging to a solution different to the truth.
Evaluation Pictures
Example nominal SCOBJs:
Final solution SCOBJs:

SCOBJ without center-of-body shift
3D graphs of final SPC-derived SCOBJ and true SCOBJ are re-plotted for each evaluation picture, now including the single result from the additional subtest conducted from a 35cm Preliminary Survey Start Model with no center-of-body shift. The graphs show that the final SCOBJ is not affected by center-of-body shift up to 2m. This result also dispels the notion that the distance of the final SCOBJs from truth is connected to the center-of-body shift.
