|
Size: 23
Comment:
|
Size: 5108
Comment:
|
| Deletions are marked like this. | Additions are marked like this. |
| Line 2: | Line 2: |
== Definitions == '''CompareOBJ RMS:''' The root mean square of the distance from each bigmap pixel/line location to the nearest facet of the truth OBJ.<<BR>> '''PTG:''' The formal camera pointing uncertainty. '''SCOBJ:''' The S/C position vector from the center of the asteroid. '''VSO:''' The formal SCOBJ uncertainty. == S/C position and pointing uncertainties == The Detailed Survey PolyCam F3G data set had large S/C position and pointing uncertainties, unsuitable for Detailed Survey Baseball Diamond trajectories: * VSO = 1km; * PTG = 1mrad. An additional suite of tests was therefore run with a duplicate Detailed Survey PolyCam dataset with S/C position and pointing uncertainties set to one-sigma: * VSO = 6.4m; * PTG = 0.217mrad. Results for both data sets are presented herein. == Comments == The results show no significant difference in the final S/C position (SCOBJ) and model accuracy (as measured with CompareOBJ RMS) with respect to the magnitude of S/C position and pointing perturbation within the ranges tested, indicating that the SPC-driven modeling is immune to S/C position and pointing perturbation up to three standard deviations. It should be noted that S/C position perturbation was divided equally between the SCOBJ components, resulting in a distance from the truth position which was a multiple of the standard deviation of 6.4m. Therefore: * maximum lateral perturbation was a multiple of 3.7m (6.4m/sqrt(3)); * maximum normal perturbation (wrt body center) was 3.7m (6.4m/sqrt(3)). It is assumed that the worst case scenario is a 3 x sigma (19.2m) lateral perturbation. The maximum possible lateral perturbation tested was 3 x 3.7m = 11.1m. In all cases, the final SPC-derived S/C position is within 8m of the true S/C position, but in only two cases is within 2m of the true S/C position. The actual distance from the true S/C position is not dependent on the initial perturbed position - for example in the 0.25 x sigma case, the SPC-derived S/C position (distance from truth: 1.6m to 6.9m) in most cases moves further away from the true S/C position than its initial position (distance from truth: 1.6m). The final SPC-derived S/C positions appear to be clustered around an incorrect solution 2m-8m distant from the true S/C position. == CompareOBJ RMS == The CompareOBJ RMS (for the final 5cm resolution 20m x 20m evaluation bigmap) does not appear to be affected by the magnitude of S/C position and pointing perturbation within the ranges tested. {{attachment:CompareOBJ_RMS_resized.png}} '''CompareOBJ Optimal Translations:''' ||'''Sub-Test'''||'''Perturbation Magnitude'''||||||'''Translation (cm)'''|| ||F3G7||0.25 x sigma||85.0698||62.3596||-14.3765|| ||F3G6||0.50 x sigma||84.5538||61.6624||-15.3434|| ||F3G5||0.75 x sigma||95.8438||59.9313||-21.6901|| ||F3G3||1.00 x sigma||106.4870||58.2162||-27.3527|| ||F3G4||1.50 x sigma||79.1224||63.2865||-19.6432|| ||F3G2||2.00 x sigma||110.1339||58.9454||-23.2403|| ||F3G1||3.00 x sigma||93.5937||61.6997||-26.8422|| == Image Footprints == The first graph shows footprints for all Detailed Survey PolyCam pictures which were included in the model. The second graph shows the four pictures down-selected due to their coverage of the 20m x 20m evaluation region, and their almost complete containment within the iterated 100m x 100m region. {{attachment:vertices_all_resized.png}} {{attachment:vertices_eval_resized.png}} == Distance SCOBJ(truth) to SCOBJ(solution) == The distance of the final SPC-derived S/C position from the true S/C position is plotted for the full Detailed Survey PolyCam image set for each magnitude of perturbation. The evaluation images are plotted in red. 3D graphs of final SPC-derived SCOBJ and true SCOBJ are then plotted for each picture. The first four are the down-selected evaluation pictures, the rest of the image set is included for comparison. The pattern of final SPC-derived SCOBJ is broadly consistent across magnitudes of perturbation. The position correction is mostly a normal correction with lateral movement, bringing the modeled S/C position within an approx. 8m-radius sphere around the true position (or, in the case of perturbations<8m, pushing SCOBJ outwards up to 8m). {{attachment:scobj_distance_resized.png}} === Evaluation Pictures === '''Example nominal SCOBJs:''' {{attachment:P601293751G3_nominal_resized.png}} ''' Final solution SCOBJs:''' {{attachment:P601293751G3_final_resized.png}} {{attachment:P601372862G2_final_resized.png}} {{attachment:P601372868G2_final_resized.png}} {{attachment:P601372874G2_final_resized.png}} === Remaining Detailed Survey PolyCam Pictures === {{attachment:P601293196G2_final_resized.png}} {{attachment:P601293757G3_final_resized.png}} {{attachment:P601372298G3_final_resized.png}} {{attachment:P601372304G3_final_resized.png}} {{attachment:P601372310G3_final_resized.png}} {{attachment:P601372316G3_final_resized.png}} {{attachment:P601372856G2_final_resized.png}} |
TestF3G - Results
Definitions
CompareOBJ RMS: The root mean square of the distance from each bigmap pixel/line location to the nearest facet of the truth OBJ.
PTG: The formal camera pointing uncertainty. SCOBJ: The S/C position vector from the center of the asteroid. VSO: The formal SCOBJ uncertainty.
S/C position and pointing uncertainties
The Detailed Survey PolyCam F3G data set had large S/C position and pointing uncertainties, unsuitable for Detailed Survey Baseball Diamond trajectories:
- VSO = 1km;
- PTG = 1mrad.
An additional suite of tests was therefore run with a duplicate Detailed Survey PolyCam dataset with S/C position and pointing uncertainties set to one-sigma:
- VSO = 6.4m;
- PTG = 0.217mrad.
Results for both data sets are presented herein.
Comments
The results show no significant difference in the final S/C position (SCOBJ) and model accuracy (as measured with CompareOBJ RMS) with respect to the magnitude of S/C position and pointing perturbation within the ranges tested, indicating that the SPC-driven modeling is immune to S/C position and pointing perturbation up to three standard deviations.
It should be noted that S/C position perturbation was divided equally between the SCOBJ components, resulting in a distance from the truth position which was a multiple of the standard deviation of 6.4m. Therefore:
- maximum lateral perturbation was a multiple of 3.7m (6.4m/sqrt(3));
- maximum normal perturbation (wrt body center) was 3.7m (6.4m/sqrt(3)).
It is assumed that the worst case scenario is a 3 x sigma (19.2m) lateral perturbation. The maximum possible lateral perturbation tested was 3 x 3.7m = 11.1m.
In all cases, the final SPC-derived S/C position is within 8m of the true S/C position, but in only two cases is within 2m of the true S/C position. The actual distance from the true S/C position is not dependent on the initial perturbed position - for example in the 0.25 x sigma case, the SPC-derived S/C position (distance from truth: 1.6m to 6.9m) in most cases moves further away from the true S/C position than its initial position (distance from truth: 1.6m).
The final SPC-derived S/C positions appear to be clustered around an incorrect solution 2m-8m distant from the true S/C position.
CompareOBJ RMS
The CompareOBJ RMS (for the final 5cm resolution 20m x 20m evaluation bigmap) does not appear to be affected by the magnitude of S/C position and pointing perturbation within the ranges tested.
CompareOBJ Optimal Translations:
Sub-Test |
Perturbation Magnitude |
Translation (cm) |
||
0.25 x sigma |
85.0698 |
62.3596 |
-14.3765 |
|
0.50 x sigma |
84.5538 |
61.6624 |
-15.3434 |
|
0.75 x sigma |
95.8438 |
59.9313 |
-21.6901 |
|
1.00 x sigma |
106.4870 |
58.2162 |
-27.3527 |
|
1.50 x sigma |
79.1224 |
63.2865 |
-19.6432 |
|
2.00 x sigma |
110.1339 |
58.9454 |
-23.2403 |
|
3.00 x sigma |
93.5937 |
61.6997 |
-26.8422 |
|
Image Footprints
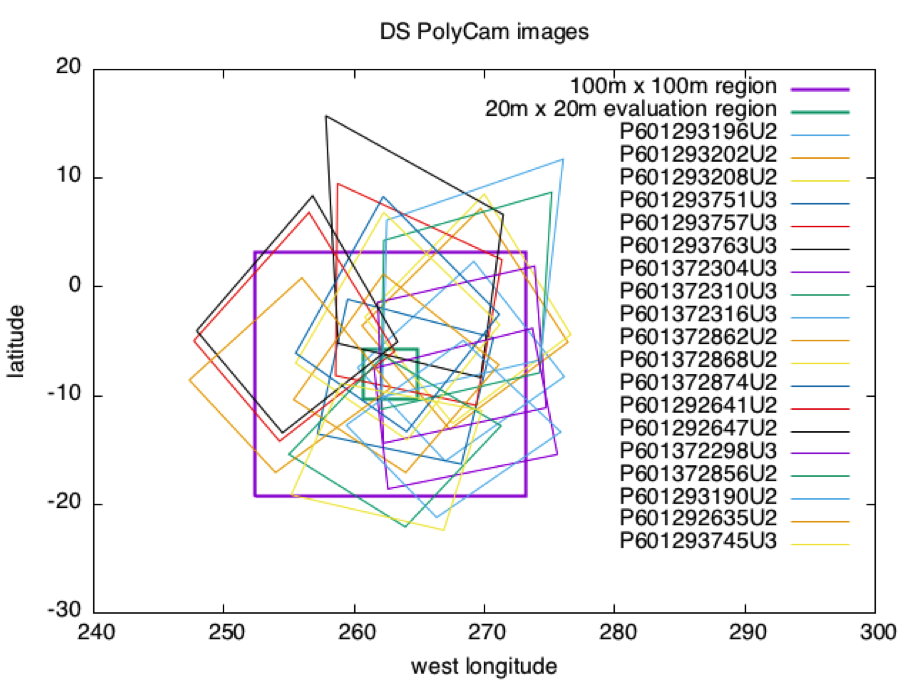
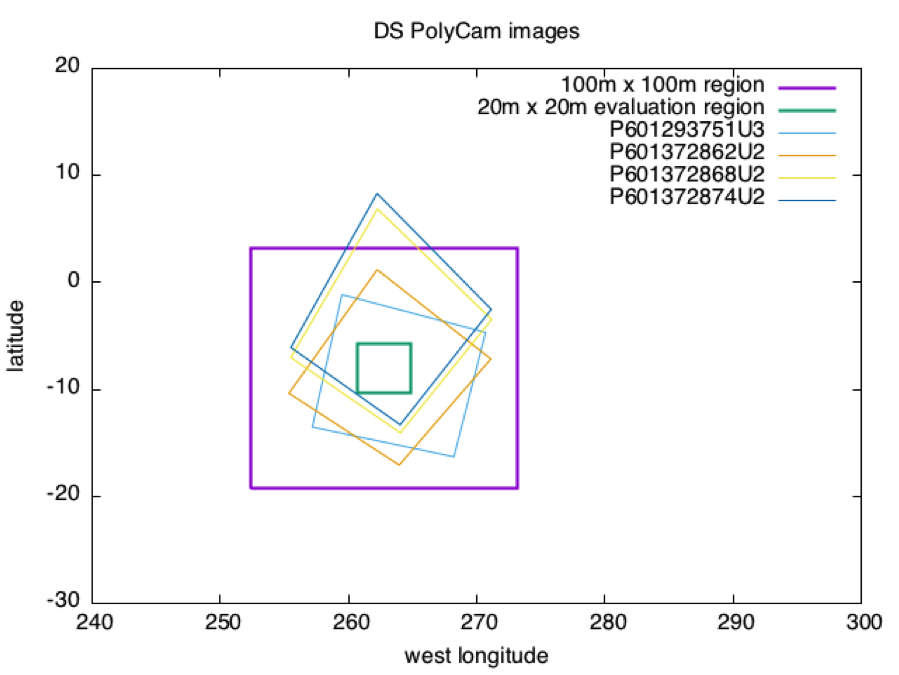
The first graph shows footprints for all Detailed Survey PolyCam pictures which were included in the model. The second graph shows the four pictures down-selected due to their coverage of the 20m x 20m evaluation region, and their almost complete containment within the iterated 100m x 100m region.


Distance SCOBJ(truth) to SCOBJ(solution)
The distance of the final SPC-derived S/C position from the true S/C position is plotted for the full Detailed Survey PolyCam image set for each magnitude of perturbation. The evaluation images are plotted in red.
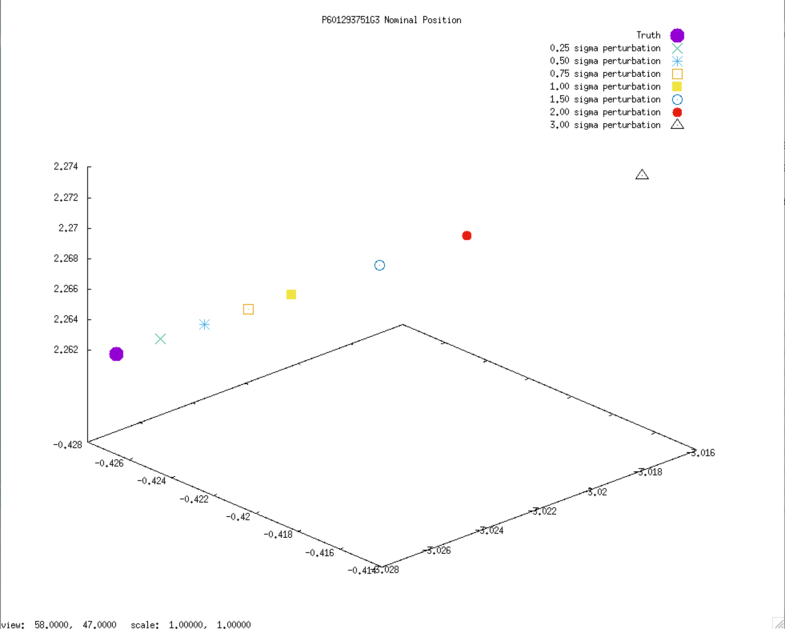
3D graphs of final SPC-derived SCOBJ and true SCOBJ are then plotted for each picture. The first four are the down-selected evaluation pictures, the rest of the image set is included for comparison.
The pattern of final SPC-derived SCOBJ is broadly consistent across magnitudes of perturbation. The position correction is mostly a normal correction with lateral movement, bringing the modeled S/C position within an approx. 8m-radius sphere around the true position (or, in the case of perturbations<8m, pushing SCOBJ outwards up to 8m).
Evaluation Pictures
Example nominal SCOBJs:

Final solution SCOBJs:
