|
Size: 1980
Comment:
|
Size: 4442
Comment:
|
| Deletions are marked like this. | Additions are marked like this. |
| Line 2: | Line 2: |
== Definitions == '''CompareOBJ RMS:''' The root mean square of the distance from each bigmap pixel/line location to the nearest facet of the truth OBJ.<<BR>> '''SCOBJ:''' The S/C position vector from the center of the asteroid. == Comments == The results show no significant difference in the final S/C position (SCOBJ) and model accuracy (as measured with CompareOBJ RMS) with respect to the magnitude of S/C position and pointing perturbation within the ranges tested, indicating that the SPC-driven modeling is immune to S/C position and pointing perturbation up to three standard deviations. It should be noted that S/C position perturbation was divided equally between the SCOBJ components, resulting in a distance from the truth position which was a multiple of the standard deviation of 6.4m. Therefore: * maximum lateral perturbation was a multiple of 3.7m (6.4m/sqrt(3)); * normal perturbation (wrt body center) was 3.7m (6.4m/sqrt(3)). It is assumed that the worst case scenario is a 3 x sigma (19.2m) lateral perturbation. The maximum possible lateral perturbation tested was 3 x 3.7m = 11.1m. In all cases, the final SPC-derived S/C position is within 8m of the true S/C position, but in only two cases is within 2m of the true S/C position. The actual distance from the true S/C position is not dependent on the initial perturbed position - for example in the 0.25 x sigma case, the SPC-derived S/C position (distance from truth: 1.6m to 6.9m) in most cases moves further away from the true S/C position than its initial position (distance from truth: 1.6m). The final SPC-derived S/C positions appear to be clustered around an incorrect solution 2m-8m distant from the true S/C position. |
|
| Line 5: | Line 23: |
| CompareOBJ does not appear to be affected by the magnitude of S/C position and pointing perturbation within the ranges tested. |
|
| Line 6: | Line 26: |
'''CompareOBJ Optimal Translations:''' ||'''Sub-Test'''||'''Perturbation Magnitude'''||||||'''Translation (cm)'''|| ||F3G7||0.25 x sigma||85.0698||62.3596||-14.3765|| ||F3G6||0.50 x sigma||84.5538||61.6624||-15.3434|| ||F3G5||0.75 x sigma||95.8438 59.9313 -21.6901|| ||F3G3||1.00 x sigma||106.4870 58.2162 -27.3527|| ||F3G4||1.50 x sigma||79.1224 63.2865 -19.6432|| ||F3G2||2.00 x sigma||110.1339 58.9454 -23.2403|| ||F3G1||3.00 x sigma||93.5937 61.6997 -26.8422|| |
|
| Line 17: | Line 47: |
| SCOBJ is the S/C position from the center of the asteroid. | The distance of the final SPC-derived S/C position from the true S/C position is plotted for the full Detailed Survey PolyCam image set for each magnitude of perturbation. The evaluation images are plotted in red. |
| Line 19: | Line 49: |
| Distance magnitude is plotted for the full Detailed Survey PolyCam picture set. The evaluation pictures are plotted in red. | 3D graphs of final SPC-derived SCOBJ and true SCOBJ are then plotted for each picture. The first four are the down-selected evaluation pictures, the rest of the image set is included for comparison. |
| Line 21: | Line 51: |
| 3D graphs of final SCOBJ and truth are then plotted for each picture. The first four are the down-selected evaluation pictures, the rest of the set is included for comparison. The pattern of final SCOBJ for magnitude of perturbation is broadly consistent, indicating that the position correction is mostly a Z-component correction. Lateral perturbations remain in the final position. |
The pattern of final SPC-derived SCOBJ is broadly consistent across magnitudes of perturbation. The position correction is mostly a normal correction with lateral movement, bringing the modeled S/C position within an approx. 8m-radius sphere around the true position (or, in the case of perturbations<8m, pushing SCOBJ outwards up to 8m). |
| Line 30: | Line 58: |
{{attachment:P601293751G3_nominalsOnly_resized.png}} |
TestF3G - Results
Definitions
CompareOBJ RMS: The root mean square of the distance from each bigmap pixel/line location to the nearest facet of the truth OBJ.
SCOBJ: The S/C position vector from the center of the asteroid.
Comments
The results show no significant difference in the final S/C position (SCOBJ) and model accuracy (as measured with CompareOBJ RMS) with respect to the magnitude of S/C position and pointing perturbation within the ranges tested, indicating that the SPC-driven modeling is immune to S/C position and pointing perturbation up to three standard deviations.
It should be noted that S/C position perturbation was divided equally between the SCOBJ components, resulting in a distance from the truth position which was a multiple of the standard deviation of 6.4m. Therefore:
- maximum lateral perturbation was a multiple of 3.7m (6.4m/sqrt(3));
- normal perturbation (wrt body center) was 3.7m (6.4m/sqrt(3)).
It is assumed that the worst case scenario is a 3 x sigma (19.2m) lateral perturbation. The maximum possible lateral perturbation tested was 3 x 3.7m = 11.1m.
In all cases, the final SPC-derived S/C position is within 8m of the true S/C position, but in only two cases is within 2m of the true S/C position. The actual distance from the true S/C position is not dependent on the initial perturbed position - for example in the 0.25 x sigma case, the SPC-derived S/C position (distance from truth: 1.6m to 6.9m) in most cases moves further away from the true S/C position than its initial position (distance from truth: 1.6m).
The final SPC-derived S/C positions appear to be clustered around an incorrect solution 2m-8m distant from the true S/C position.
CompareOBJ RMS
CompareOBJ does not appear to be affected by the magnitude of S/C position and pointing perturbation within the ranges tested.
CompareOBJ Optimal Translations:
Sub-Test |
Perturbation Magnitude |
Translation (cm) |
||
0.25 x sigma |
85.0698 |
62.3596 |
-14.3765 |
|
0.50 x sigma |
84.5538 |
61.6624 |
-15.3434 |
|
0.75 x sigma |
95.8438 59.9313 -21.6901 |
|||
1.00 x sigma |
106.4870 58.2162 -27.3527 |
|||
1.50 x sigma |
79.1224 63.2865 -19.6432 |
|||
2.00 x sigma |
110.1339 58.9454 -23.2403 |
|||
3.00 x sigma |
93.5937 61.6997 -26.8422 |
|||
Image Footprints
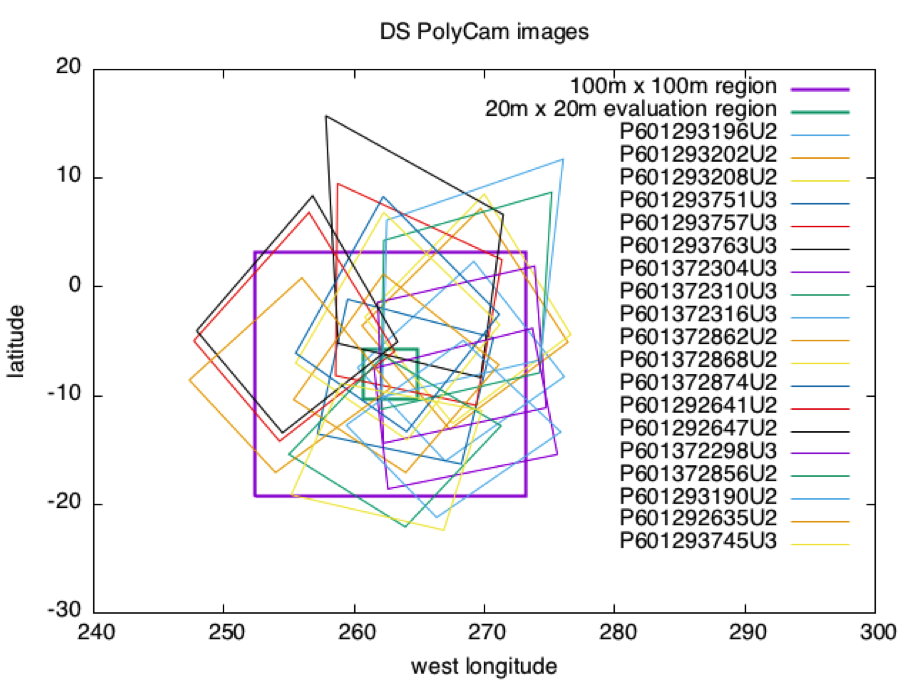
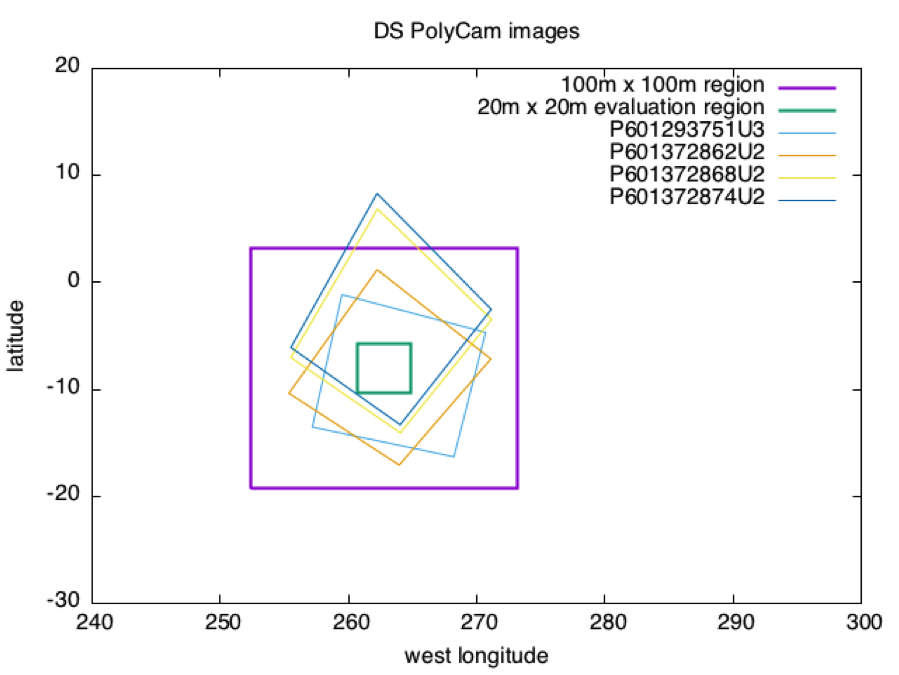
The first graph shows footprints for all Detailed Survey PolyCam pictures which were included in the model. The second graph shows the four pictures down-selected due to their coverage of the 20m x 20m evaluation region, and their almost complete containment within the iterated 100m x 100m region.


Distance SCOBJ(truth) to SCOBJ(solution)
The distance of the final SPC-derived S/C position from the true S/C position is plotted for the full Detailed Survey PolyCam image set for each magnitude of perturbation. The evaluation images are plotted in red.
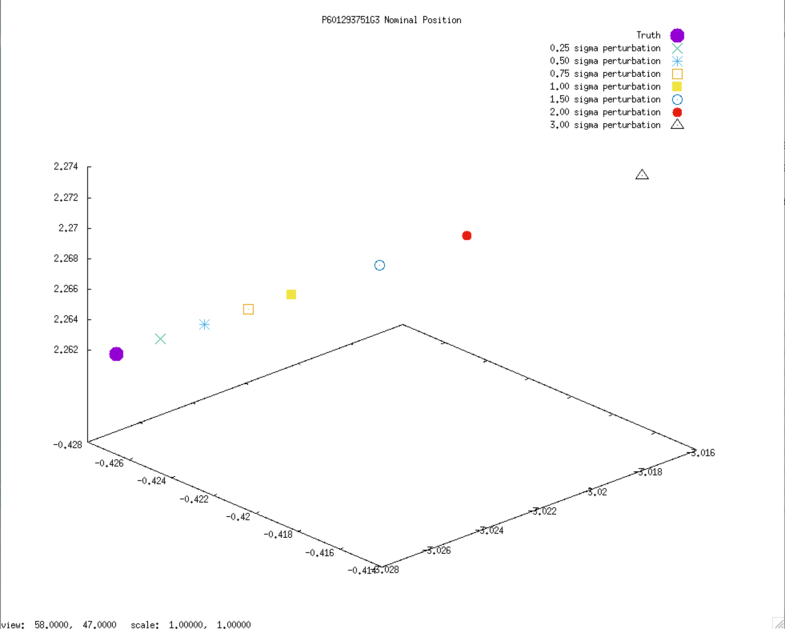
3D graphs of final SPC-derived SCOBJ and true SCOBJ are then plotted for each picture. The first four are the down-selected evaluation pictures, the rest of the image set is included for comparison.
The pattern of final SPC-derived SCOBJ is broadly consistent across magnitudes of perturbation. The position correction is mostly a normal correction with lateral movement, bringing the modeled S/C position within an approx. 8m-radius sphere around the true position (or, in the case of perturbations<8m, pushing SCOBJ outwards up to 8m).
Evaluation Pictures
Example nominal SCOBJs:

Final solution SCOBJs:
