|
Size: 1525
Comment:
|
Size: 12859
Comment:
|
| Deletions are marked like this. | Additions are marked like this. |
| Line 1: | Line 1: |
| = TestF3G - Results = | = TestF3G - Navigation Error Sensitivity Test Results = |
| Line 3: | Line 3: |
| == CompareOBJ RMS == | == Definitions == |
| Line 5: | Line 5: |
| {{attachment:CompareOBJ_RMS_resized.png}} | ||'''CompareOBJ RMS:'''||The root mean square of the distance from each bigmap pixel/line location to the nearest facet of the truth OBJ.|| ||'''PTG:'''||The formal camera pointing uncertainty.|| ||'''SCOBJ:'''||The S/C position vector from the center of the asteroid.|| ||'''VSO:'''||The formal SCOBJ uncertainty.|| |
| Line 7: | Line 10: |
| == Image Footprints == | == Additional Tests == |
| Line 9: | Line 12: |
| The first graph shows footprints for all Detailed Survey PolyCam images which were included in the model. The second graph shows the four images down-selected due to their coverage of the 20m x 20m evaluation region, and their almost complete containment within the iterated 100m x 100m region. | === S/C Position and Camera Pointing Uncertainties === The Detailed Survey PolyCam F3G data set had large S/C position and pointing uncertainties, unsuitable for Detailed Survey Baseball Diamond trajectories: * VSO = 1km; * PTG = 1mrad. An additional suite of tests was therefore run with a duplicate Detailed Survey PolyCam dataset with S/C position and pointing uncertainties set to one-sigma: * VSO = 6.4m; * PTG = 0.217mrad. Results for both data sets are presented herein. === Model Center-of-Body Shift === In the process of generating the 35cm Preliminary Shape Model, a shift in the body center with respect to the inertial center was applied. The magnitude of the shift was approximately 2m. Since the final S/C position across F3G subtests lay in a region 2m to 8m from the true S/C position, the effect of the body center shift came into question. To investigate, an alternative 35cm Preliminary Shape Model with no body-center shift was generated. One subtest was re-run using the alternative start model. == Key Findings == CompareOBJ RMSs (with and without translation/rotation) show no trend with the magnitude of S/C position and camera pointing perturbation within the perturbation ranges tested. The correlation score also does not vary with the magnitude of S/C position and camera pointing perturbation and is approx. 0.76 giving a very good indication of correlation. The accuracy of the evaluation model is therefore invariant to the S/C position or camera pointing perturbation up to three standard deviations. The results show no significant difference in the final S/C position (SCOBJ) with respect to the magnitude of S/C position and camera pointing perturbation within the ranges tested, indicating that the SPC-driven S/C position modeling is immune to S/C position and pointing perturbation up to three standard deviations. With the large S/C position and camera pointing uncertainties, the final SPC-derived S/C position is within 8m of the true S/C position, and in two cases is within 2m of the true S/C position. With the reduced (1 sigma) S/C position and camera pointing uncertainties, all the final SPC-derived S/C positions are within 2m of the true S/C position. The distance between the final S/C position and the true S/C position is not dependent on the initial perturbed S/C position - indeed, in the 0.25 x sigma case, the SPC-derived S/C position in most cases moves further away from the true S/C position (final distance from truth: 1.6m to 6.9m) than its initial position (initial distance from truth: 1.6m). The final SPC-derived S/C positions appear to be clustered around an incorrect solution 2m distant from the true S/C position (in the VSO=1sigma tests). This distance appears to correspond with a shift in the center-of-body which was applied during the generation of the 35cm Preliminary Survey Start Model. However, this finding persisted when a subtest was re-run with a 35cm Preliminary Survey Start Model which had not had a shift applied to the center-of-body. Measures of both model accuracy and S/C position did not vary with center-of-body shift. == Important Notes == It should be noted that S/C position perturbation was divided equally between the SCOBJ components, resulting in a distance from the truth position which was a multiple of the standard deviation of 6.4m. Therefore: * maximum lateral perturbation was a multiple of 3.7m (6.4m/sqrt(3)); * maximum normal perturbation (wrt body center) was a multiple of 3.7m (6.4m/sqrt(3)). It is assumed that the worst case scenario is a 3 x sigma (19.2m) lateral perturbation. The maximum possible lateral perturbation tested was 3 x 3.7m = 11.1m. == Results and Discussion == === CompareOBJ RMS === Three CompareOBJ RMS values for the final 5cm resolution 20m x 20m evaluation bigmap are presented for each subtest and each S/C position and camera pointing uncertainty: * The largest CompareOBJ RMS (approx. 65cm across subtests) is obtained by running CompareOBJ on the untranslated and unrotated evaluation model. * The second smallest CompareOBJ RMS (approx. 15cm across subtests) is obtained by running CompareOBJ with its optimal translation and rotation option. * The smallest CompareOBJ RMS (approx. 9cm across subtests) is obtained by manually translating the evaluation model and searching for a local CompareOBJ RMS minimum. The CompareOBJ optimal translation routine is not optimized for the evaluation model scale (5cm pix/line resolution). Manual translations of the bigmap were therefore conducted in an attempt to find a minimum CompareOBJ RMS. The manually translated evaluation models gave the smallest CompareOBJ RMSs. CompareOBJ RMSs do not show a trend with the magnitude of S/C position and pointing perturbation within the ranges tested. CompareOBJ RMSs differ slightly with S/C position and camera pointing uncertainties, with smaller RMS values corresponding with lower uncertainties: * approx. 5cm difference for CompareOBJ RMS without translation/rotation; * approx. 2cm difference for CompareOBJ RMS with optimal translation and rotation; * approx. 0.4cm difference for CompareOBJ RMS with manual translation. {{attachment:CompareOBJ_VSO_1km_resized60pt.png}} {{attachment:CompareOBJ_VSO_1sigma_resized60pt.png}} '''CompareOBJ Optimal Translations:''' ||'''Sub-Test'''||'''S/C Position Uncertainty'''||'''Perturbation Magnitude'''||'''RMS (cm)'''||||||'''Translation (cm)'''||'''Translated Distance (cm)'''|| ||F3G7a||1km||0.25 x sigma||15.7849||85.0698||62.3596||-14.3765||106.4532|| ||F3G6a||1km||0.50 x sigma||15.1147||84.5538||61.6624||-15.3434||105.7687|| ||F3G5a||1km||0.75 x sigma||14.3150||95.8438||59.9313||-21.6901||115.1011|| ||F3G3a||1km||1.00 x sigma||13.6399||106.4870||58.2162||-27.3527||124.4057|| ||F3G4a||1km||1.50 x sigma||15.8949||79.1224||63.2865||-19.6432||103.2056|| ||F3G2a||1km||2.00 x sigma||13.6938||110.1339||58.9454||-23.2403||127.0596|| ||F3G1a||1km||3.00 x sigma||14.6271||93.5937||61.6997||-26.8422||115.2698|| ||'''Sub-Test'''||'''S/C Position Uncertainty'''||'''Perturbation Magnitude'''||'''RMS (cm)'''||||||'''Translation (cm)'''||'''Translated Distance (cm)'''|| ||F3G7b||6.4m||0.25 x sigma||15.9614||95.5555||66.8688||-17.6793||117.9613|| ||F3G6b||6.4m||0.50 x sigma||16.0260||93.7254||66.9687||-17.2331||116.4743|| ||F3G5b||6.4m||0.75 x sigma||16.4387||88.3626||69.0785||-12.1628||112.8172|| ||F3G3b||6.4m||1.00 x sigma||9.5449||167.5406||57.3951||-27.0780||179.1571|| ||F3G4b||6.4m||1.50 x sigma||16.0525||93.4737||70.0956||-15.0998||117.808=1|| ||F3G2b||6.4m||2.00 x sigma||16.1591||94.1139||69.1165||-19.95051||118.4514|| ||F3G1b||6.4m||3.00 x sigma||15.2938||101.8134||70.3467||-20.3179||125.4091|| '''CompareOBJ Manual Translations:''' ||'''Sub-Test'''||'''S/C Position Uncertainty'''||'''Perturbation Magnitude'''||'''RMS (cm)'''||||||'''Translation (cm)'''||'''Translated Distance (cm)'''|| ||F3G7a||1km||0.25 x sigma||8.0140||187.5||47.5||-30||195.74|| ||F3G6a||1km||0.50 x sigma||7.9343||187.5||47.5||-30||195.74|| ||F3G5a||1km||0.75 x sigma||7.9579||187.5||47.5||-30||195.74|| ||F3G3a||1km||1.00 x sigma||7.6749||187.5||47.5||-30||195.74|| ||F3G4a||1km||1.50 x sigma||7.9964||187.5||47.5||-40||197.52|| ||F3G2a||1km||2.00 x sigma||7.8591||187.5||47.5||-40||197.52|| ||F3G1a||1km||3.00 x sigma||7.6739||187.5||47.5||-50||209.19|| ||'''Sub-Test'''||'''S/C Position Uncertainty'''||'''Perturbation Magnitude'''||'''RMS (cm)'''||||||'''Translation (cm)'''||'''Translated Distance (cm)'''|| ||F3G7b||6.4m||0.25 x sigma||8.4097||207.5||47.5||-30||214.9709|| ||F3G6b||6.4m||0.50 x sigma||8.3974||207.5||47.5||-30||214.9709|| ||F3G5b||6.4m||0.75 x sigma||8.5008||207.5||47.5||-30||214.9709|| ||F3G3b||6.4m||1.00 x sigma||8.2400||207.5||47.5||-40||216.5929|| ||F3G4b||6.4m||1.50 x sigma||8.5820||197.5||57.5||-20||206.6700|| ||F3G2b||6.4m||2.00 x sigma||8.4134||197.5||57.5||-30||207.8762|| ||F3G1b||6.4m||3.00 x sigma||7.9259||197.5||57.5||-30||207.8762|| === Cross Correlation Scores === The evaluation maps were compared with a truth map via a cross-correlation routine which derives a correlation score. As a guide the following scores show perfect and excellent correlations: * A map cross-correlated with itself will give a correlation score of approx. 1.0; * Different sized maps sampled from the same truth (for example a 1,100 x 1,100 5cm sample map and a 1,000 x 1,000 5cm sample map) give a correlation score of approx. 0.8. The correlation scores show no trend with S/C position and camera pointing perturbation in the perturbation-range tested. The correlation scores also do not differ with S/C position and camera pointing uncertainties. The correlation score across subtests is approx. 0.76 giving a very good indication of correlation. '''Correlation Scores:''' ||'''Sub-Test'''||'''S/C Position Uncertainty'''||'''Perturbation Magnitude'''||'''Correlation Score'''|| ||F3G7a||1km||0.25 x sigma||0.7619|| ||F3G6a||1km||0.50 x sigma||0.7625|| ||F3G5a||1km||0.75 x sigma||0.7617|| ||F3G3a||1km||1.00 x sigma||0.7641|| ||F3G4a||1km||1.50 x sigma||0.7684|| ||F3G2a||1km||2.00 x sigma||0.7537|| ||F3G1a||1km||3.00 x sigma||0.7679|| ||'''Sub-Test'''||'''S/C Position Uncertainty'''||'''Perturbation Magnitude'''||'''Correlation Score'''|| ||F3G7b||6.4m||0.25 x sigma||0.7628|| ||F3G6b||6.4m||0.50 x sigma||0.7633|| ||F3G5b||6.4m||0.75 x sigma||0.7637|| ||F3G3b||6.4m||1.00 x sigma||0.7672|| ||F3G4b||6.4m||1.50 x sigma||0.7606|| ||F3G2b||6.4m||2.00 x sigma||0.7510|| ||F3G1b||6.4m||3.00 x sigma||0.7683|| === Image Footprints === The first graph shows footprints for all Detailed Survey PolyCam pictures which were included in the model. The second graph shows the four pictures down-selected due to their coverage of the 20m x 20m evaluation region, and their almost complete containment within the iterated 100m x 100m region. |
| Line 15: | Line 143: |
| == Distance SCOBJ(truth) to SCOBJ(solution) == | === Distance SCOBJ(truth) to SCOBJ(solution) === |
| Line 17: | Line 145: |
| Distance magnitude is plotted for the full Detailed Survey PolyCam image set. 3D graphs of final SCOBJ and truth is then plotted for each image. The first four are the down-selected evaluation images, the rest of the set is included for comparison. | The distance of the final SPC-derived S/C position from the true S/C position is plotted for the evaluation Detailed Survey PolyCam image set for each magnitude of perturbation. The distance of the final SCOBJ from the true S/C position is invariant with the perturbation to the initial SCOBJ within the perturbation-range tested. The variance in distances across pictures does vary with S/C position uncertainty however, with: * distances ranging from approx. 1m to 8m with VSO=1km; * distances ranging from approx. 1m to 2m with VSO=6.4m (1 sigma). |
| Line 19: | Line 149: |
| {{attachment:scobj_distance_resized.png}} | {{attachment:SCOBJ_distance_VSO_1km_resized60pct.png}} |
| Line 21: | Line 151: |
| === Evaluation Pictures === | {{attachment:SCOBJ_distance_VSO_1sigma_resized60pct.png}} === SCOBJ === 3D graphs of final SPC-derived SCOBJ and true SCOBJ are plotted for each evaluation picture. The pattern of final SPC-derived SCOBJ is broadly consistent across magnitudes of perturbation. The position correction is mostly a normal correction with lateral movement, bringing the modeled S/C position within an approx. 2m to 8m of the true S/C position. Note that the SCOBJs form a cluster which is offset from the truth indicating that the model is converging to a solution different to the truth. ==== Evaluation Pictures ==== '''Example nominal SCOBJs:''' |
| Line 25: | Line 165: |
| {{attachment:P601372862G2_final_resized.png}} | ''' Final solution SCOBJs:''' |
| Line 27: | Line 167: |
| {{attachment:P601372868G2_final_resized.png}} | {{attachment:P601293751G3_All_resized_40pct.png}} |
| Line 29: | Line 169: |
| {{attachment:P601372874G2_final_resized.png}} | {{attachment:P601372862G2_All_resized_40pct.png}} |
| Line 31: | Line 171: |
| === Remaining Detailed Survey PolyCam Pictures === | {{attachment:P601372868G2_All_resized_40pct.png}} |
| Line 33: | Line 173: |
| {{attachment:P601293196G2_final_resized.png}} | {{attachment:P601372874G2_All_resized_40pct.png}} |
| Line 35: | Line 175: |
| {{attachment:P601293751G3_final_resized.png}} | === SCOBJ without center-of-body shift === |
| Line 37: | Line 177: |
| {{attachment:P601293757G3_final_resized.png}} | 3D graphs of final SPC-derived SCOBJ and true SCOBJ are re-plotted for each evaluation picture, now including the single result from the additional subtest conducted from a 35cm Preliminary Survey Start Model with no center-of-body shift. The graphs show that the final SCOBJ is not affected by center-of-body shift up to 2m. This result also dispels the notion that the distance of the final SCOBJs from truth is connected to the center-of-body shift. |
| Line 39: | Line 179: |
| {{attachment:P601372298G3_final_resized.png}} | {{attachment:P601293751G3_woShift_resized_40pct.png}} |
| Line 41: | Line 181: |
| {{attachment:P601372304G3_final_resized.png}} | {{attachment:P601372862G2_woShift_resized_40pct.png}} |
| Line 43: | Line 183: |
| {{attachment:P601372310G3_final_resized.png}} | {{attachment:P601372868G2_woShift_resized_40pct.png}} |
| Line 45: | Line 185: |
| {{attachment:P601372316G3_final_resized.png}} {{attachment:P601372856G2_final_resized.png}} |
{{attachment:P601372874G2_woShift_resized_40pct.png}} |
TestF3G - Navigation Error Sensitivity Test Results
Definitions
CompareOBJ RMS: |
The root mean square of the distance from each bigmap pixel/line location to the nearest facet of the truth OBJ. |
PTG: |
The formal camera pointing uncertainty. |
SCOBJ: |
The S/C position vector from the center of the asteroid. |
VSO: |
The formal SCOBJ uncertainty. |
Additional Tests
S/C Position and Camera Pointing Uncertainties
The Detailed Survey PolyCam F3G data set had large S/C position and pointing uncertainties, unsuitable for Detailed Survey Baseball Diamond trajectories:
- VSO = 1km;
- PTG = 1mrad.
An additional suite of tests was therefore run with a duplicate Detailed Survey PolyCam dataset with S/C position and pointing uncertainties set to one-sigma:
- VSO = 6.4m;
- PTG = 0.217mrad.
Results for both data sets are presented herein.
Model Center-of-Body Shift
In the process of generating the 35cm Preliminary Shape Model, a shift in the body center with respect to the inertial center was applied. The magnitude of the shift was approximately 2m. Since the final S/C position across F3G subtests lay in a region 2m to 8m from the true S/C position, the effect of the body center shift came into question. To investigate, an alternative 35cm Preliminary Shape Model with no body-center shift was generated. One subtest was re-run using the alternative start model.
Key Findings
CompareOBJ RMSs (with and without translation/rotation) show no trend with the magnitude of S/C position and camera pointing perturbation within the perturbation ranges tested. The correlation score also does not vary with the magnitude of S/C position and camera pointing perturbation and is approx. 0.76 giving a very good indication of correlation. The accuracy of the evaluation model is therefore invariant to the S/C position or camera pointing perturbation up to three standard deviations.
The results show no significant difference in the final S/C position (SCOBJ) with respect to the magnitude of S/C position and camera pointing perturbation within the ranges tested, indicating that the SPC-driven S/C position modeling is immune to S/C position and pointing perturbation up to three standard deviations.
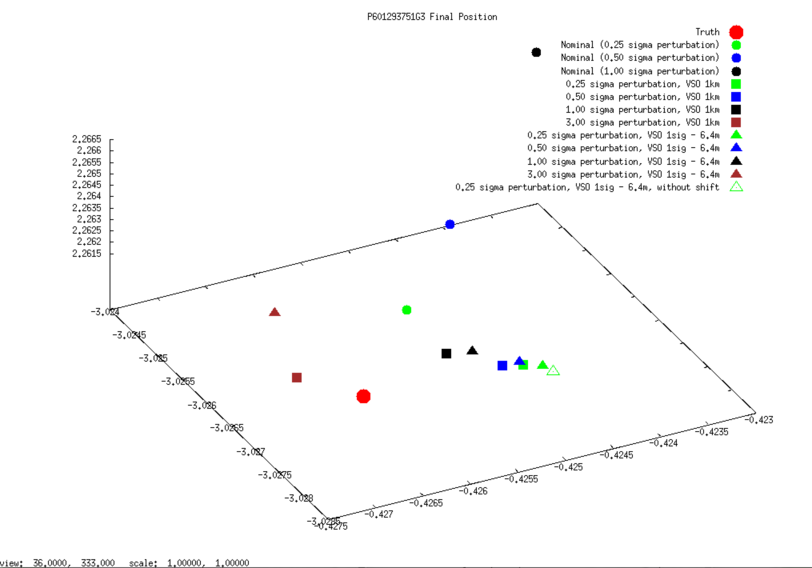
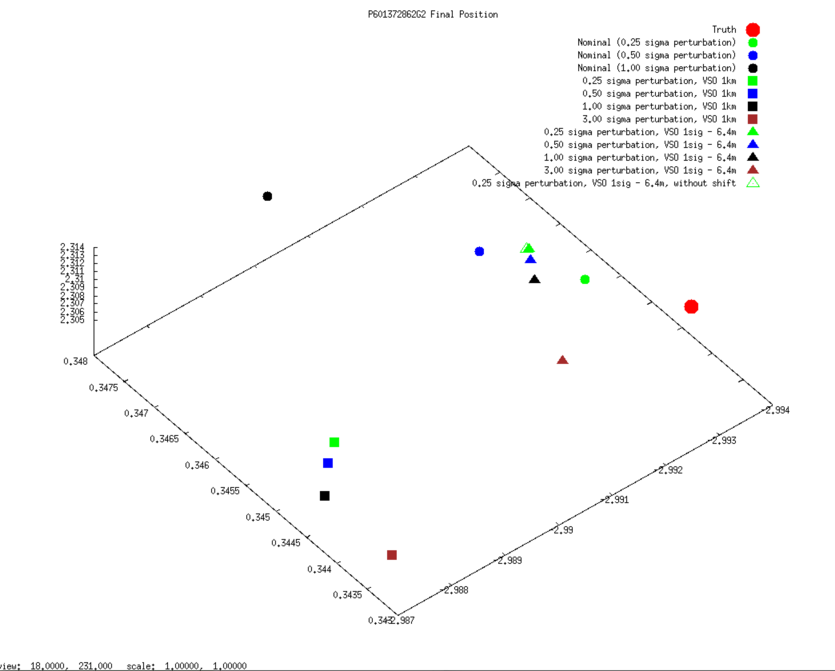
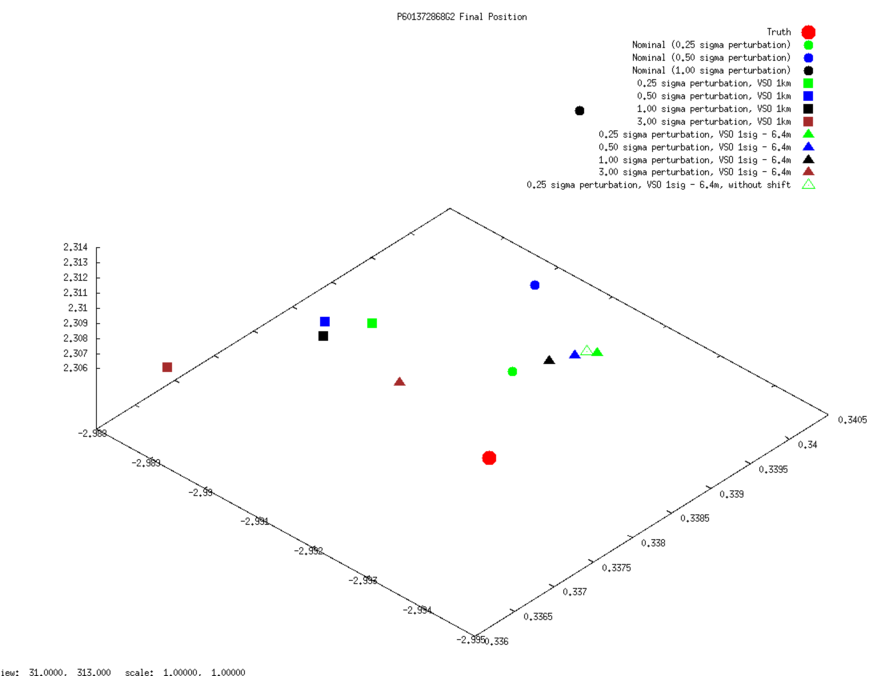
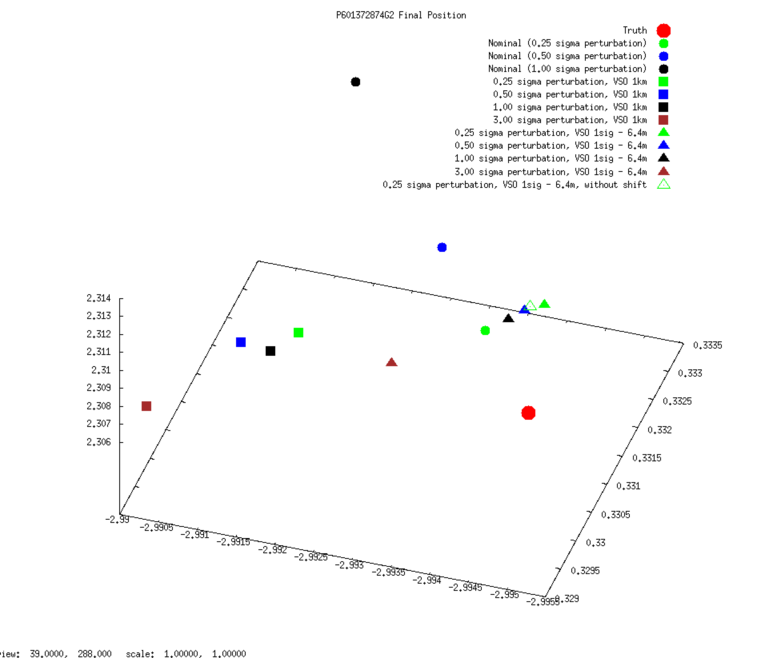
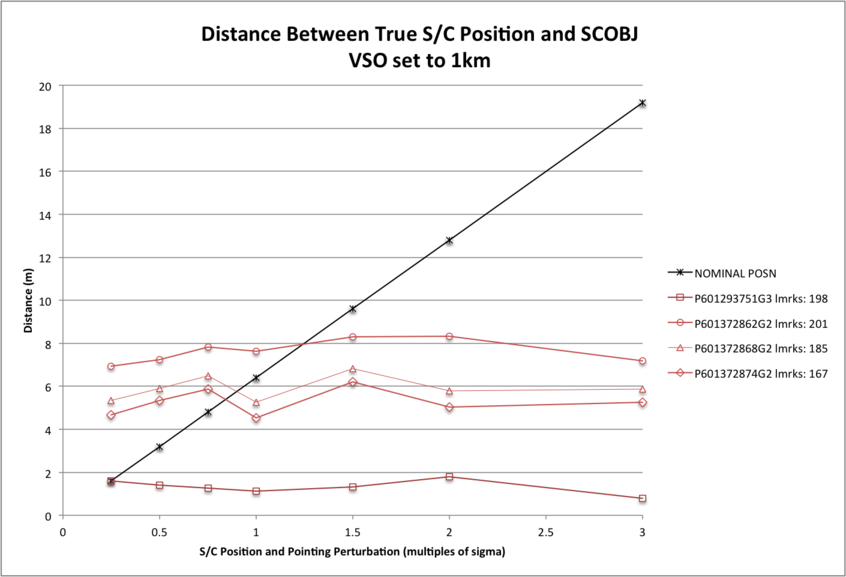
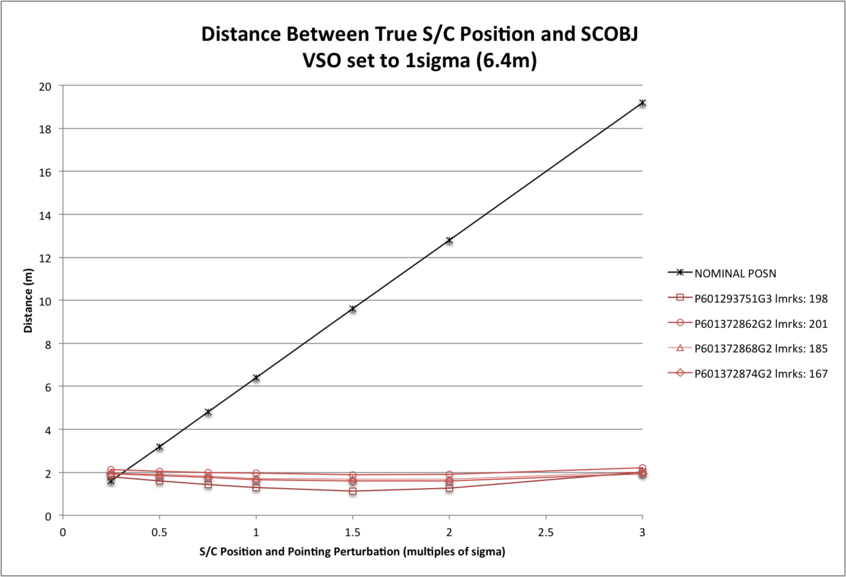
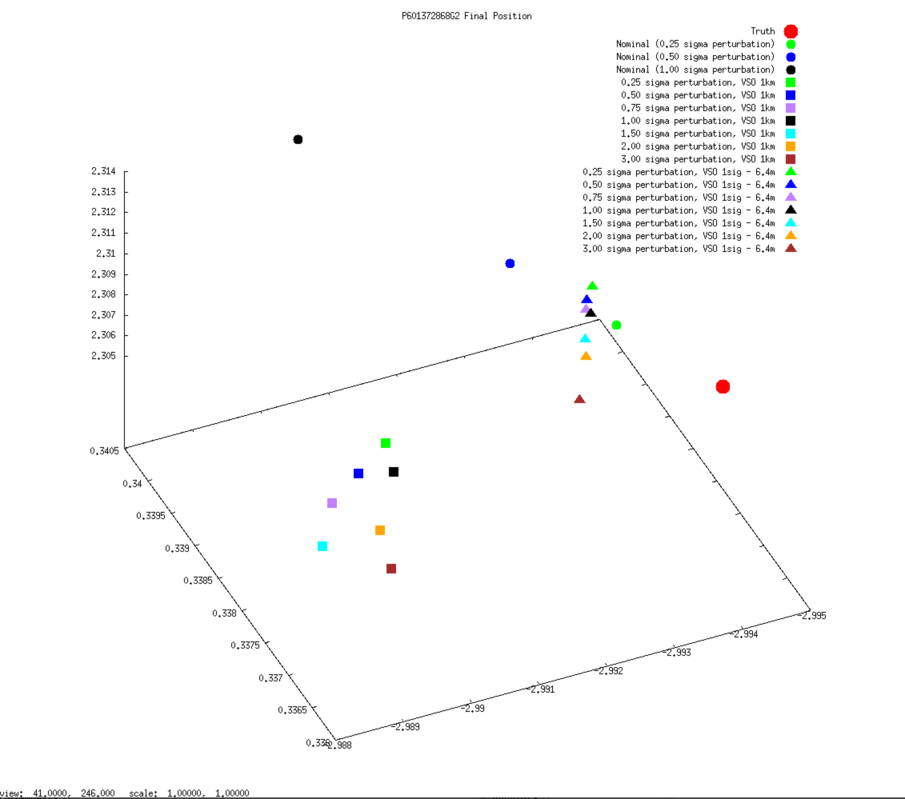
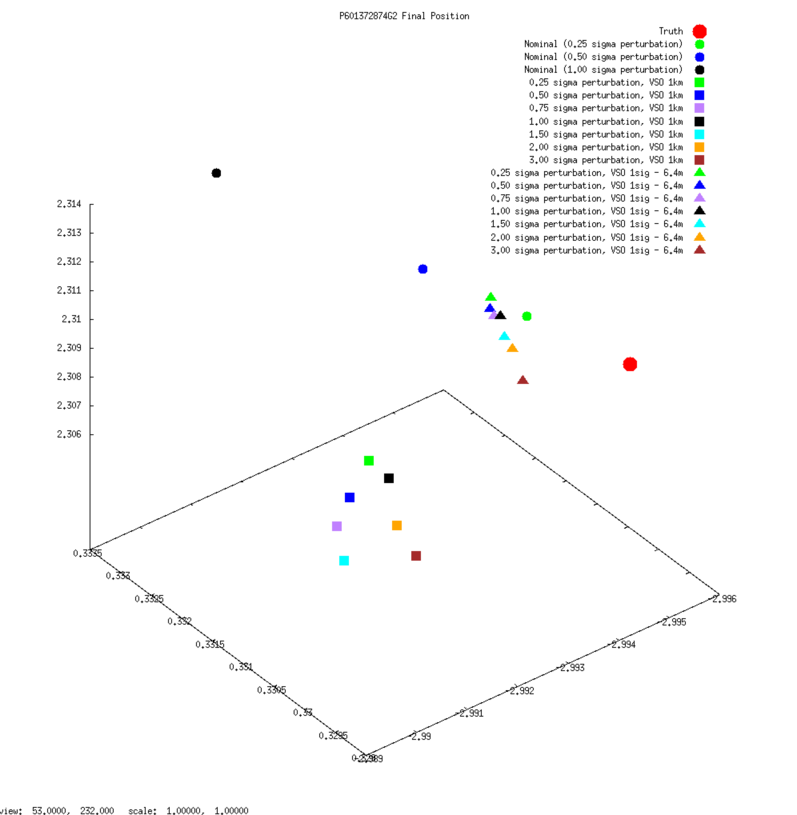
With the large S/C position and camera pointing uncertainties, the final SPC-derived S/C position is within 8m of the true S/C position, and in two cases is within 2m of the true S/C position. With the reduced (1 sigma) S/C position and camera pointing uncertainties, all the final SPC-derived S/C positions are within 2m of the true S/C position. The distance between the final S/C position and the true S/C position is not dependent on the initial perturbed S/C position - indeed, in the 0.25 x sigma case, the SPC-derived S/C position in most cases moves further away from the true S/C position (final distance from truth: 1.6m to 6.9m) than its initial position (initial distance from truth: 1.6m).
The final SPC-derived S/C positions appear to be clustered around an incorrect solution 2m distant from the true S/C position (in the VSO=1sigma tests). This distance appears to correspond with a shift in the center-of-body which was applied during the generation of the 35cm Preliminary Survey Start Model. However, this finding persisted when a subtest was re-run with a 35cm Preliminary Survey Start Model which had not had a shift applied to the center-of-body. Measures of both model accuracy and S/C position did not vary with center-of-body shift.
Important Notes
It should be noted that S/C position perturbation was divided equally between the SCOBJ components, resulting in a distance from the truth position which was a multiple of the standard deviation of 6.4m. Therefore:
- maximum lateral perturbation was a multiple of 3.7m (6.4m/sqrt(3));
- maximum normal perturbation (wrt body center) was a multiple of 3.7m (6.4m/sqrt(3)).
It is assumed that the worst case scenario is a 3 x sigma (19.2m) lateral perturbation. The maximum possible lateral perturbation tested was 3 x 3.7m = 11.1m.
Results and Discussion
CompareOBJ RMS
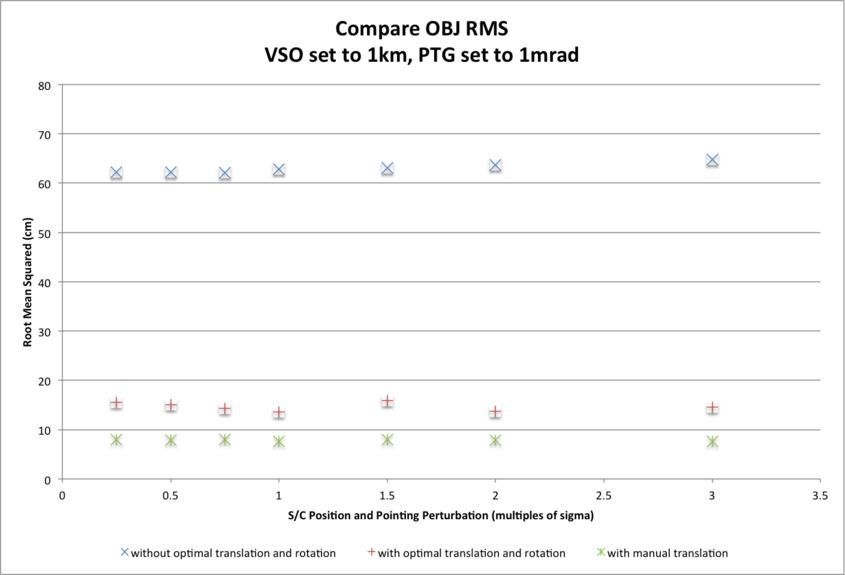
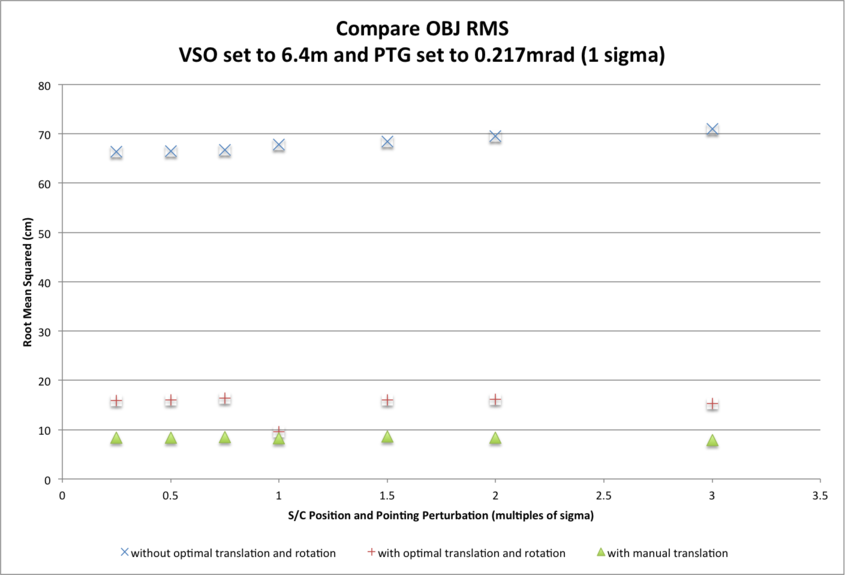
Three CompareOBJ RMS values for the final 5cm resolution 20m x 20m evaluation bigmap are presented for each subtest and each S/C position and camera pointing uncertainty:
- The largest CompareOBJ RMS (approx. 65cm across subtests) is obtained by running CompareOBJ on the untranslated and unrotated evaluation model.
- The second smallest CompareOBJ RMS (approx. 15cm across subtests) is obtained by running CompareOBJ with its optimal translation and rotation option.
- The smallest CompareOBJ RMS (approx. 9cm across subtests) is obtained by manually translating the evaluation model and searching for a local CompareOBJ RMS minimum.
The CompareOBJ optimal translation routine is not optimized for the evaluation model scale (5cm pix/line resolution). Manual translations of the bigmap were therefore conducted in an attempt to find a minimum CompareOBJ RMS. The manually translated evaluation models gave the smallest CompareOBJ RMSs.
CompareOBJ RMSs do not show a trend with the magnitude of S/C position and pointing perturbation within the ranges tested.
CompareOBJ RMSs differ slightly with S/C position and camera pointing uncertainties, with smaller RMS values corresponding with lower uncertainties:
- approx. 5cm difference for CompareOBJ RMS without translation/rotation;
- approx. 2cm difference for CompareOBJ RMS with optimal translation and rotation;
- approx. 0.4cm difference for CompareOBJ RMS with manual translation.
CompareOBJ Optimal Translations:
Sub-Test |
S/C Position Uncertainty |
Perturbation Magnitude |
RMS (cm) |
Translation (cm) |
Translated Distance (cm) |
||
1km |
0.25 x sigma |
15.7849 |
85.0698 |
62.3596 |
-14.3765 |
106.4532 |
|
1km |
0.50 x sigma |
15.1147 |
84.5538 |
61.6624 |
-15.3434 |
105.7687 |
|
1km |
0.75 x sigma |
14.3150 |
95.8438 |
59.9313 |
-21.6901 |
115.1011 |
|
1km |
1.00 x sigma |
13.6399 |
106.4870 |
58.2162 |
-27.3527 |
124.4057 |
|
1km |
1.50 x sigma |
15.8949 |
79.1224 |
63.2865 |
-19.6432 |
103.2056 |
|
1km |
2.00 x sigma |
13.6938 |
110.1339 |
58.9454 |
-23.2403 |
127.0596 |
|
1km |
3.00 x sigma |
14.6271 |
93.5937 |
61.6997 |
-26.8422 |
115.2698 |
|
Sub-Test |
S/C Position Uncertainty |
Perturbation Magnitude |
RMS (cm) |
Translation (cm) |
Translated Distance (cm) |
||
6.4m |
0.25 x sigma |
15.9614 |
95.5555 |
66.8688 |
-17.6793 |
117.9613 |
|
6.4m |
0.50 x sigma |
16.0260 |
93.7254 |
66.9687 |
-17.2331 |
116.4743 |
|
6.4m |
0.75 x sigma |
16.4387 |
88.3626 |
69.0785 |
-12.1628 |
112.8172 |
|
6.4m |
1.00 x sigma |
9.5449 |
167.5406 |
57.3951 |
-27.0780 |
179.1571 |
|
6.4m |
1.50 x sigma |
16.0525 |
93.4737 |
70.0956 |
-15.0998 |
117.808=1 |
|
6.4m |
2.00 x sigma |
16.1591 |
94.1139 |
69.1165 |
-19.95051 |
118.4514 |
|
6.4m |
3.00 x sigma |
15.2938 |
101.8134 |
70.3467 |
-20.3179 |
125.4091 |
|
CompareOBJ Manual Translations:
Sub-Test |
S/C Position Uncertainty |
Perturbation Magnitude |
RMS (cm) |
Translation (cm) |
Translated Distance (cm) |
||
1km |
0.25 x sigma |
8.0140 |
187.5 |
47.5 |
-30 |
195.74 |
|
1km |
0.50 x sigma |
7.9343 |
187.5 |
47.5 |
-30 |
195.74 |
|
1km |
0.75 x sigma |
7.9579 |
187.5 |
47.5 |
-30 |
195.74 |
|
1km |
1.00 x sigma |
7.6749 |
187.5 |
47.5 |
-30 |
195.74 |
|
1km |
1.50 x sigma |
7.9964 |
187.5 |
47.5 |
-40 |
197.52 |
|
1km |
2.00 x sigma |
7.8591 |
187.5 |
47.5 |
-40 |
197.52 |
|
1km |
3.00 x sigma |
7.6739 |
187.5 |
47.5 |
-50 |
209.19 |
|
Sub-Test |
S/C Position Uncertainty |
Perturbation Magnitude |
RMS (cm) |
Translation (cm) |
Translated Distance (cm) |
||
6.4m |
0.25 x sigma |
8.4097 |
207.5 |
47.5 |
-30 |
214.9709 |
|
6.4m |
0.50 x sigma |
8.3974 |
207.5 |
47.5 |
-30 |
214.9709 |
|
6.4m |
0.75 x sigma |
8.5008 |
207.5 |
47.5 |
-30 |
214.9709 |
|
6.4m |
1.00 x sigma |
8.2400 |
207.5 |
47.5 |
-40 |
216.5929 |
|
6.4m |
1.50 x sigma |
8.5820 |
197.5 |
57.5 |
-20 |
206.6700 |
|
6.4m |
2.00 x sigma |
8.4134 |
197.5 |
57.5 |
-30 |
207.8762 |
|
6.4m |
3.00 x sigma |
7.9259 |
197.5 |
57.5 |
-30 |
207.8762 |
|
Cross Correlation Scores
The evaluation maps were compared with a truth map via a cross-correlation routine which derives a correlation score. As a guide the following scores show perfect and excellent correlations:
- A map cross-correlated with itself will give a correlation score of approx. 1.0;
- Different sized maps sampled from the same truth (for example a 1,100 x 1,100 5cm sample map and a 1,000 x 1,000 5cm sample map) give a correlation score of approx. 0.8.
The correlation scores show no trend with S/C position and camera pointing perturbation in the perturbation-range tested. The correlation scores also do not differ with S/C position and camera pointing uncertainties. The correlation score across subtests is approx. 0.76 giving a very good indication of correlation.
Correlation Scores:
Sub-Test |
S/C Position Uncertainty |
Perturbation Magnitude |
Correlation Score |
1km |
0.25 x sigma |
0.7619 |
|
1km |
0.50 x sigma |
0.7625 |
|
1km |
0.75 x sigma |
0.7617 |
|
1km |
1.00 x sigma |
0.7641 |
|
1km |
1.50 x sigma |
0.7684 |
|
1km |
2.00 x sigma |
0.7537 |
|
1km |
3.00 x sigma |
0.7679 |
Sub-Test |
S/C Position Uncertainty |
Perturbation Magnitude |
Correlation Score |
6.4m |
0.25 x sigma |
0.7628 |
|
6.4m |
0.50 x sigma |
0.7633 |
|
6.4m |
0.75 x sigma |
0.7637 |
|
6.4m |
1.00 x sigma |
0.7672 |
|
6.4m |
1.50 x sigma |
0.7606 |
|
6.4m |
2.00 x sigma |
0.7510 |
|
6.4m |
3.00 x sigma |
0.7683 |
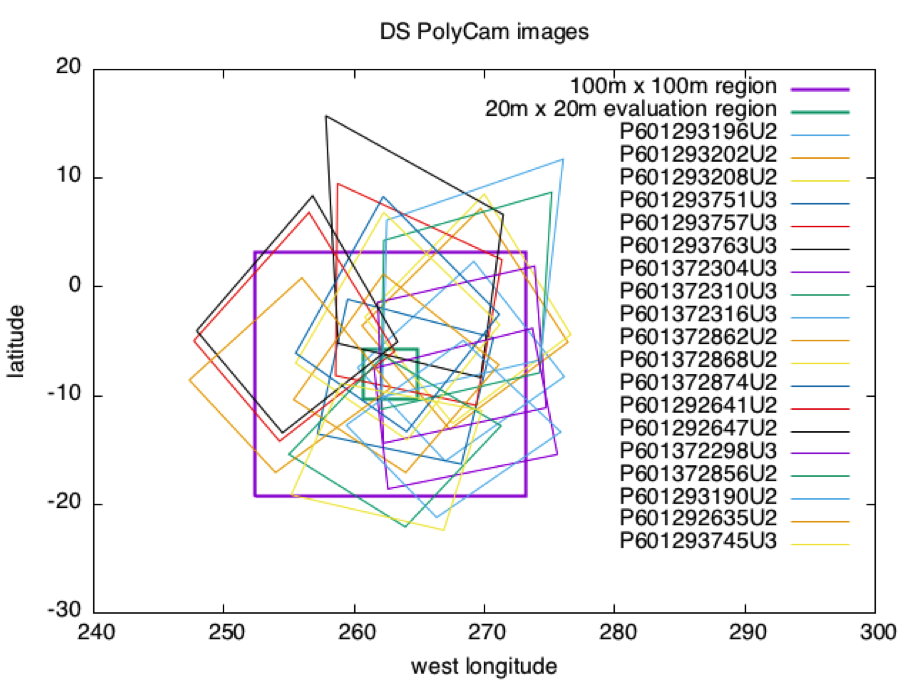
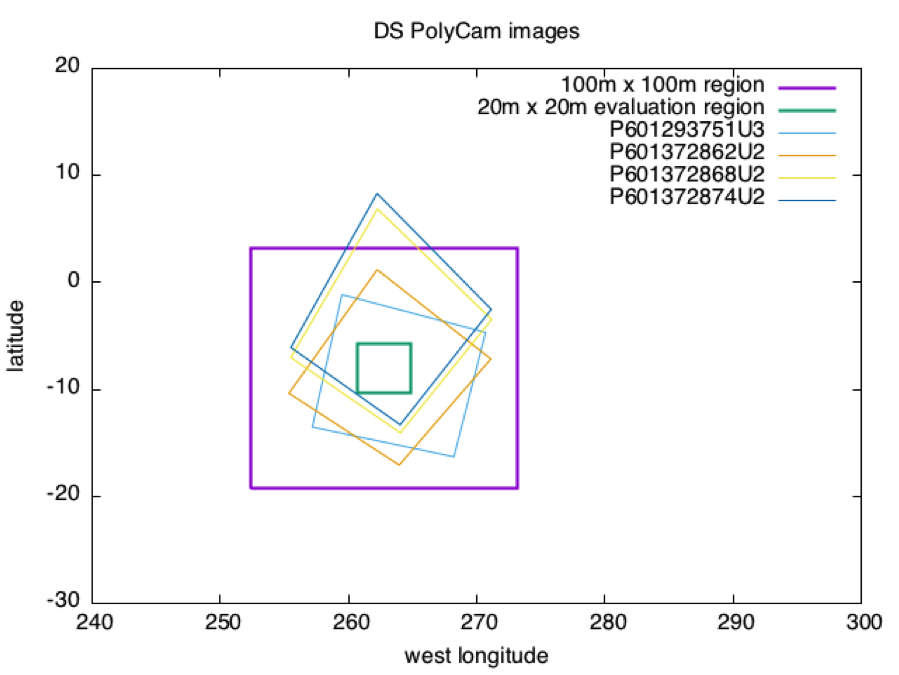
Image Footprints
The first graph shows footprints for all Detailed Survey PolyCam pictures which were included in the model. The second graph shows the four pictures down-selected due to their coverage of the 20m x 20m evaluation region, and their almost complete containment within the iterated 100m x 100m region.
Distance SCOBJ(truth) to SCOBJ(solution)
The distance of the final SPC-derived S/C position from the true S/C position is plotted for the evaluation Detailed Survey PolyCam image set for each magnitude of perturbation. The distance of the final SCOBJ from the true S/C position is invariant with the perturbation to the initial SCOBJ within the perturbation-range tested. The variance in distances across pictures does vary with S/C position uncertainty however, with:
- distances ranging from approx. 1m to 8m with VSO=1km;
- distances ranging from approx. 1m to 2m with VSO=6.4m (1 sigma).
SCOBJ
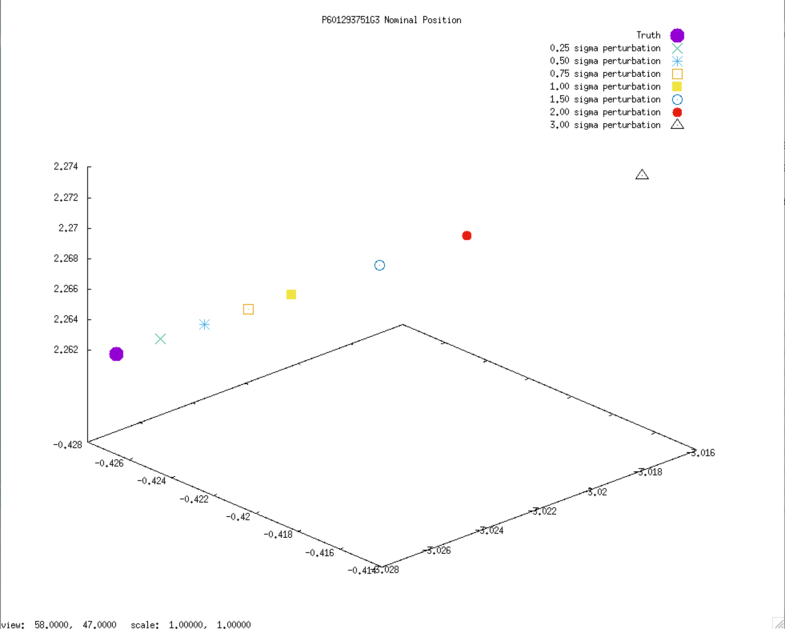
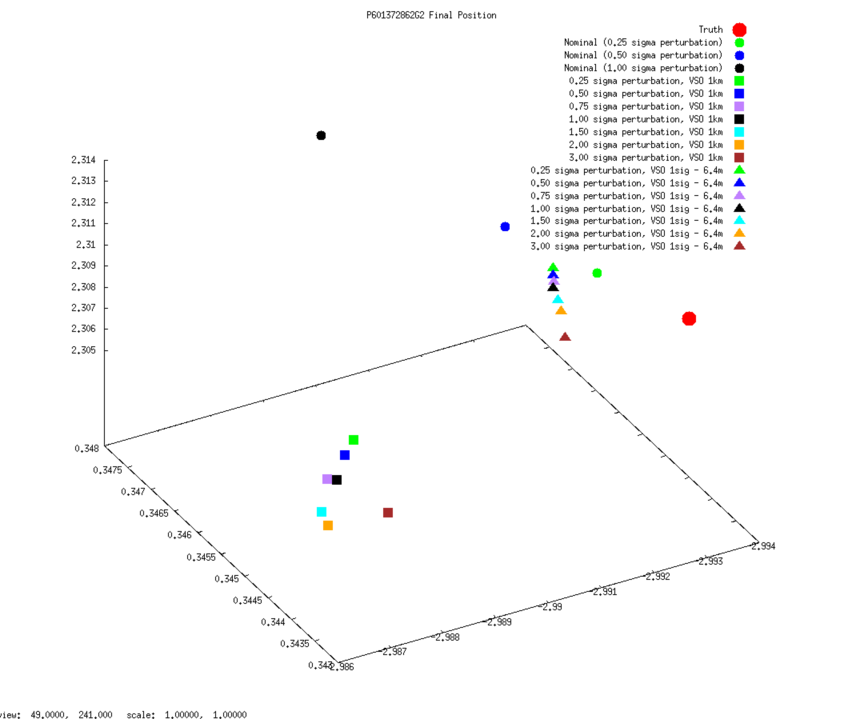
3D graphs of final SPC-derived SCOBJ and true SCOBJ are plotted for each evaluation picture.
The pattern of final SPC-derived SCOBJ is broadly consistent across magnitudes of perturbation. The position correction is mostly a normal correction with lateral movement, bringing the modeled S/C position within an approx. 2m to 8m of the true S/C position. Note that the SCOBJs form a cluster which is offset from the truth indicating that the model is converging to a solution different to the truth.
Evaluation Pictures
Example nominal SCOBJs:
Final solution SCOBJs:

SCOBJ without center-of-body shift
3D graphs of final SPC-derived SCOBJ and true SCOBJ are re-plotted for each evaluation picture, now including the single result from the additional subtest conducted from a 35cm Preliminary Survey Start Model with no center-of-body shift. The graphs show that the final SCOBJ is not affected by center-of-body shift up to 2m. This result also dispels the notion that the distance of the final SCOBJs from truth is connected to the center-of-body shift.
