TestF3G - Results
CompareOBJ RMS
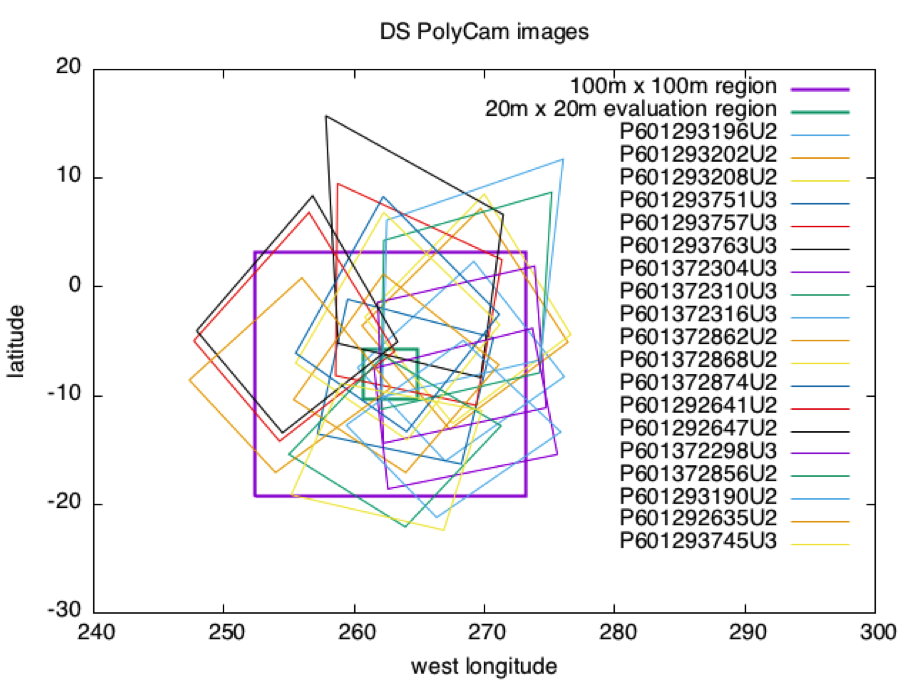
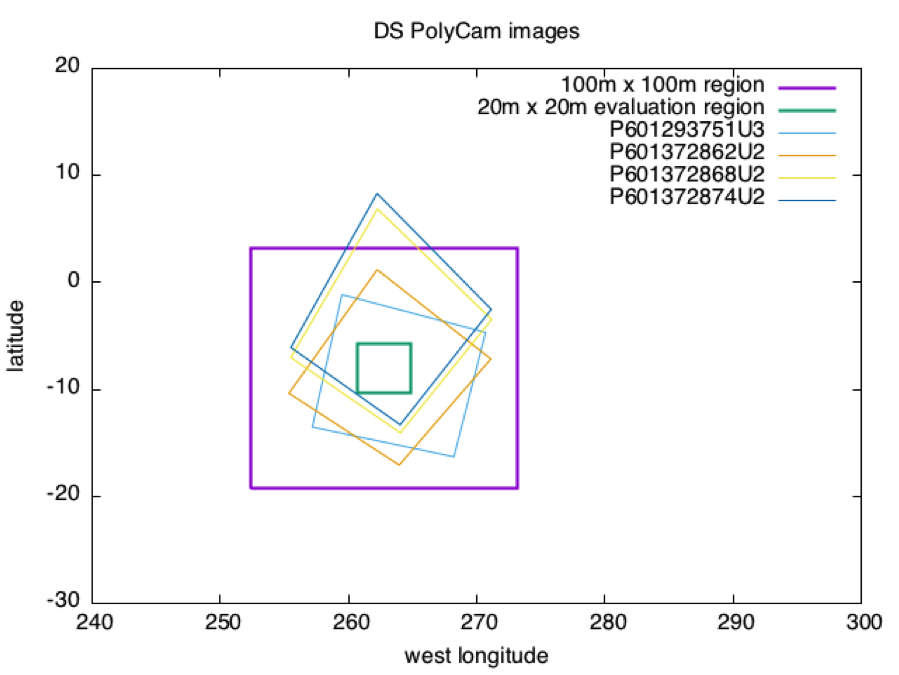
Image Footprints
The first graph shows footprints for all Detailed Survey PolyCam pictures which were included in the model. The second graph shows the four pictures down-selected due to their coverage of the 20m x 20m evaluation region, and their almost complete containment within the iterated 100m x 100m region.


Distance SCOBJ(truth) to SCOBJ(solution)
SCOBJ is the S/C position from the center of the asteroid.
Distance magnitude is plotted for the full Detailed Survey PolyCam picture set. The evaluation pictures are plotted in red.
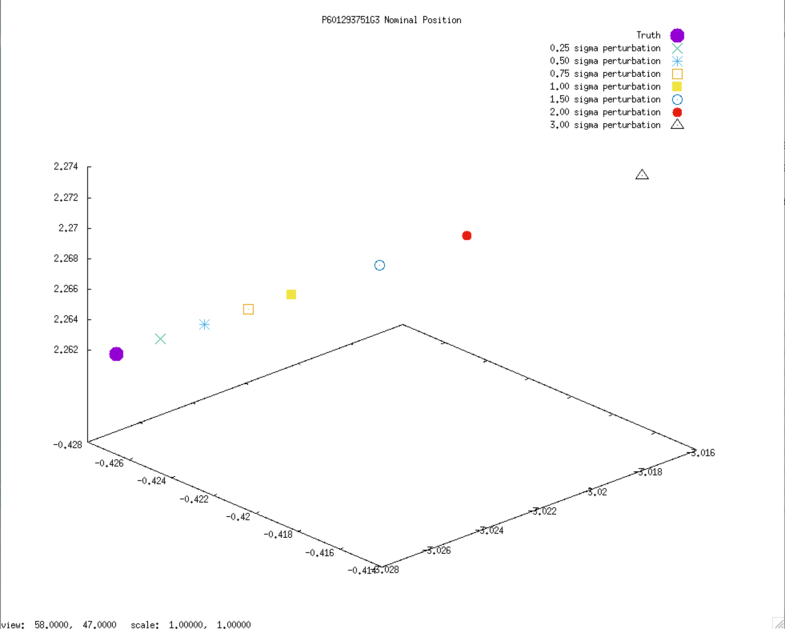
3D graphs of final SCOBJ and truth are then plotted for each picture. The first four are the down-selected evaluation pictures, the rest of the set is included for comparison.
Evaluation Pictures

