|
Size: 4244
Comment:
|
← Revision 10 as of 2016-07-13 10:37:26 ⇥
Size: 3364
Comment:
|
| Deletions are marked like this. | Additions are marked like this. |
| Line 11: | Line 11: |
| == Setup == | == Batch NCC == |
| Line 13: | Line 13: |
| There are a few prerequisites to get in order before processing can begin. First of which is gathering files. Links to text versions of all of the script files I use are provided, but feel free to adapt them to your needs, or write new ones! | It is very simple to write a bash script to iteratively run [[mpXcorr.py]] (or [[imXcorr.py]] for that matter), but [[batchCorrelation.sh]] was written specifically for this purpose and handles everything from the PGM image generation, to being able to run this in a directory where you may not have write permissions. |
| Line 15: | Line 15: |
| <<BR>> '''Step 1:''' Create a directory called COROUT in your working directory. (Can be called whatever you'd like but this will require updating the scripts) |
Running: |
| Line 20: | Line 19: |
| mkdir COROUT | sh batchCorrelation.sh -h |
| Line 24: | Line 23: |
| '''Step 2:''' Place the search image inside of COROUT. For our purposes this is generally an image rendered from the truth model using [[showmap]] | Will print out the usage header giving brief instructions to remind you of the syntax. |
| Line 28: | Line 27: |
| cp /whatever/path/truth.pgm COROUT/ | # USAGE: sh batchCorrelation.sh [-option] outpath mapfile(s) truthmap # -o Use this followed by 'outpath' to # specify a unique output destination. # By default the output is sent to the # current working directory. # # -h Use this to print usage directions # to StdOut. (Prints this header) # # -v Use this to only output current # version number and exit. By default # the version will be sent to StdOut # at the beginning of each use. # ######################################################################## |
| Line 32: | Line 45: |
| '''Step 3:''' Add the truth .MAP file to your [[MAPFILES]] directory, and update [[BIGLIST.TXT]]. Generally speaking it is bad form to have a truth map in your [[MAPFILES]] directory, but as long as this is for post-processing analysis it should be fine. It may be best to create a symbolic link. | A typical invocation of this script is as follows: |
| Line 36: | Line 49: |
| ln -s /path/to/TRUTH.MAP MAPFILES/TRUTH.MAP vi BIGLIST.TXT (insert truth map name in BIGLIST.TXT) |
sh batchCorrelation.sh /path/to/maplist /path/to/truthmap |
| Line 42: | Line 53: |
| '''Step 4:''' Create the .pgm image files of each maplet using [[showmap]]. This can be easily done in bash with the script below which takes a command line argument of your list of maplets. If you chose to not stick with the COROUT naming convention, update the $cp variable as well. | This script can be used to run on a single mapfile as well if you would like, simply run the script as above but replace "maplist" with the mapfile full name (including .MAP). If you do not have write permissions in the directory you wish to run this script, it can be run as: |
| Line 46: | Line 59: |
| file=$1 cp=COROUT list=`cat $file` for i in $list do showmap <<< $i mv $i.pgm $cp/ done |
sh batchCorrelation.sh -o /path/to/output/directory /path/to/maplist /path/to/truthmap |
| Line 59: | Line 63: |
<<BR>> == Batch NCC == '''Step 1:''' Again using a simple bash script, iteratively run [[norm_xcorr.py]] using on each maplet. Again an example is given below where paths should be updated as necessary. The command line argument should be your list of maplets. The default output file is [[locations.txt]] |
If you do not specify any command line arguments, you will be prompted for the requisite files. |
| Line 67: | Line 67: |
| file=$1 cp=COROUT list=`cat $file` rm -f locations.txt for i in $list do echo "m" > tmpf echo $i >> tmpf echo "50 50" >> tmpf read x y <<< $(/path/to/newFind < tmpf | awk '/T15-1K/{print $3, $4}') python /path/to/norm_xcorr.py -o $cp/$i.png $cp/$i.pgm $cp/T15-1K.pgm > $cp/$i.txt read tx ty <<< $(awk '/match/{print $8, $9}' $cp/$i.txt) dx=`echo "$tx-$x" | bc` dy=`echo "$ty-$y" | bc` cor=`awk '/Max/{print $4}' $cp/$i.txt` printf "$i $x $y $dx $dy $cor\n" >> locations.txt done rm tmpf |
Input single mapfile path/name or list of maplets. |
| Line 97: | Line 71: |
| This script also assumes the use of a FORTRAN program called newFind which is a standalone version of the [[lithos]] "find" option that prints to higher precision. This can easily be replaced with the lithos program instead, but expect this to approximately double processing time. '''**N.B.''' If you are changing from newFind to lithos you need to change the beginning of the for loop to call the find routine in lithos. The new script should start like this: |
Then, |
| Line 103: | Line 75: |
| . . . for i in $list do echo "f" > tmpf echo "m" >> tmpf echo $i >> tmpf echo "50 50" >> tmpf read x y <<< $(lithos < tmpf | awk '/T15-1K/{print $3, $4}') . . . |
Input path/name of truth map. |
| Line 121: | Line 79: |
| '''Step 2:''' Use [[transStats.py]] on the output file from the above script (locations.txt) to get some statistics from the batch NCC. For a more detailed description of this python script, see [[Translation Statistics]]. | Provided you did everything correctly, there should be a new directory named COROUT and a file named locations.txt wherever the specified output is (either the working directory, or that specified by "-o"). This is all well and good, but there is another python script to help you make sense of your results. Use [[transStats.py]] on the output file from the above script (locations.txt) to get some statistics from the batch NCC. For a more detailed description of this python script, see [[Translation Statistics]]. |
Batch Normalized Cross-Correlation
By TC
Description
The purpose of the batch NCC is to be able to see what areas of the topography are strongest and weakest. In general, this will be performed on the the high resolution maplets that make up the topography in question, but this process will work for any given list of maplets. Following this guide will run mpXcorr.py for each maplet specified in your input list, as well as provide several useful statistics and plots for analysis.
Batch NCC
It is very simple to write a bash script to iteratively run mpXcorr.py (or imXcorr.py for that matter), but batchCorrelation.sh was written specifically for this purpose and handles everything from the PGM image generation, to being able to run this in a directory where you may not have write permissions.
Running:
sh batchCorrelation.sh -h
Will print out the usage header giving brief instructions to remind you of the syntax.
# USAGE: sh batchCorrelation.sh [-option] outpath mapfile(s) truthmap
#     -o   Use this followed by 'outpath' to
#          specify a unique output destination.
#          By default the output is sent to the
#          current working directory.
#
#     -h   Use this to print usage directions
#          to StdOut. (Prints this header)
#
#     -v   Use this to only output current
#          version number and exit. By default
#          the version will be sent to StdOut
#          at the beginning of each use.
#
########################################################################
A typical invocation of this script is as follows:
sh batchCorrelation.sh /path/to/maplist /path/to/truthmap
This script can be used to run on a single mapfile as well if you would like, simply run the script as above but replace "maplist" with the mapfile full name (including .MAP).
If you do not have write permissions in the directory you wish to run this script, it can be run as:
sh batchCorrelation.sh -o /path/to/output/directory /path/to/maplist /path/to/truthmap
If you do not specify any command line arguments, you will be prompted for the requisite files.
Input single mapfile path/name or list of maplets.
Then,
Input path/name of truth map.
Provided you did everything correctly, there should be a new directory named COROUT and a file named locations.txt wherever the specified output is (either the working directory, or that specified by "-o"). This is all well and good, but there is another python script to help you make sense of your results.
Use transStats.py on the output file from the above script (locations.txt) to get some statistics from the batch NCC. For a more detailed description of this python script, see Translation Statistics.
python transStats.py locations.txt > transOut.txt
Visualizing Output
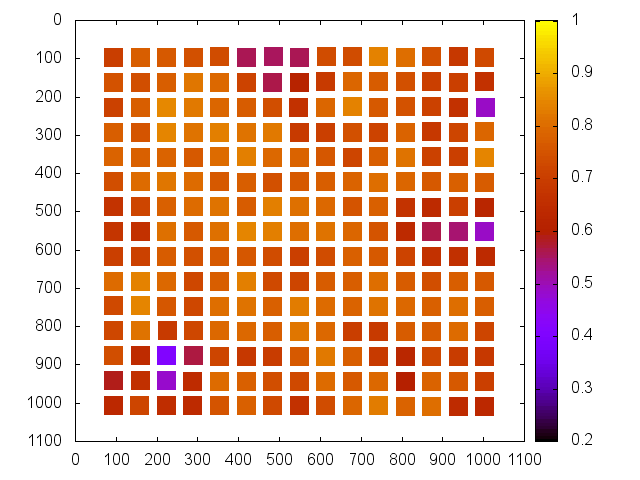
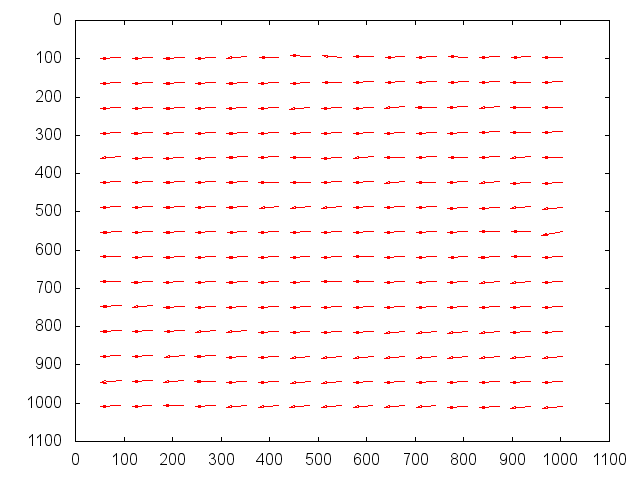
The output from the batch correlation script (locations.txt) can be plotted very easily in Gnuplot.
gnuplot

set term x11
unset key

set yrange [*:*] reverse
set cbrange [0.2:1]

plot 'locations.txt' u 2:3:4:5 w vectors

plot 'locations.txt' u 2:3:6 pal pt 5 ps 3


