|
Size: 474
Comment:
|
Size: 3769
Comment:
|
| Deletions are marked like this. | Additions are marked like this. |
| Line 6: | Line 6: |
| * ["LMKFILES"] * ["IMAGEFILES"] * ["PICTLIST.TXT"] * ["LMRKLIST.TXT"] |
* [[LMKFILES]] * [[IMAGEFILES]] * [[PICTLIST.TXT]] * [[LMRKLIST.TXT]] |
| Line 14: | Line 14: |
* The number of pixels an images needs to be "off" to throw the chevron (>>) flag * The rms error of a landmark * Sets the "bin" size for the final histogram (basically how many images are in which side categories). |
|
| Line 22: | Line 26: |
| * ["MAPINFO.TXT"] * ["PICINFO.TXT"] * ["LIMINFO.TXT"] * ["RESIDUALS.TXT"] |
* [[MAPINFO.TXT]] * [[PICINFO.TXT]] * [[LIMINFO.TXT]] * [[RESIDUALS.TXT]] === Description === * Compares predicted and observed pixel, line position of the landmarks in the images * Produces RSS of the diagonal convariance elements of each control point * Describes landmark position uncertainty * Flags landmarks with residuals over specified pixel value === Control Points === * Inputs are weights for S/C uncertainties from measurement uncertainties and from a-prior shape constraints * Control points solution results in a 3x3 output covariance for each control point. Diagonal elements are uncertainties along maplet coord. system axes, i.e. two horizontal directions & height. Typically SPC produces comparable horizontal & height uncertainties. Results are summarized as a scalar standard deviation per degree of freedom in meters * Residuals check automatically flags errors beyond certain input values in dump file for ease of inspection ===== Example ===== {{attachment:residuals_controlpoint1.jpg||width=700}} === Image Residuals === * The post-fit residuals between predicted and actual control point positions in all images are captured in the residuals file * The post-fit residuals between predicted and actual control point difference between adjacent, overlapping maplets are captured in the residuals file * Outliers in both quantities are flagged automatically based on input threshold criteria ===== Example ===== {{attachment:residuals_imageresiduals.jpg||width=500}} === Bad & Fixed Image === {{attachment:residuals_WhatWentWrong.jpg||width=700}} === Qualitative Checks === * Qualitative checks are important to verify that the quantitative error estimates are believable * Render a single maplet, or a DEM synthesized by a collection of maplets, at the same geometry & illumination conditions as the images themselves * Do all the features in the images appear in the DEM ? * Are the smallest discernible features in the images, e.g., boulders, craters etc. visible in the DEM as well ? * Is the relative albedo solution such that the relative brightness of adjacent image features matches that of the DEM ? * Are the heights solution such that the length and overall appearance of the shadows in the DEM matches that of the image ? === How are Uncertainties Introduced in the Data === * Main types of uncertainties: * S/C trajectory, camera pointing, image timestamp * Manifest themselves mostly in the projection of image template onto the surface. Corrected by global geometry solution * Image noise, artifacts, smear, overall image quality * Manifest themselves in predicted image template brightness and in its fit to the extracted image brightness * Photometric model and reflectance function models * Show up in slopes & heights integration * Poor choice of a-priori parameters & data weights * Evident at end of each estimation step; data won’t fit well * Often above contributions are correlated; individual contributors may not be separated until many processing steps have been taken |
residuals.e
Residuals tests the landmarks to look for problems. It will give you a report based on landmarks, pictures and maps.
Input - files
Input - stdin
- enter plim (px,km,km)
The number of pixels an images needs to be "off" to throw the chevron (>>) flag
- The rms error of a landmark
- Sets the "bin" size for the final histogram (basically how many images are in which side categories). input operation list
2.5, 1, 001
Output
Description
- Compares predicted and observed pixel, line position of the landmarks in the images
- Produces RSS of the diagonal convariance elements of each control point
- Describes landmark position uncertainty
- Flags landmarks with residuals over specified pixel value
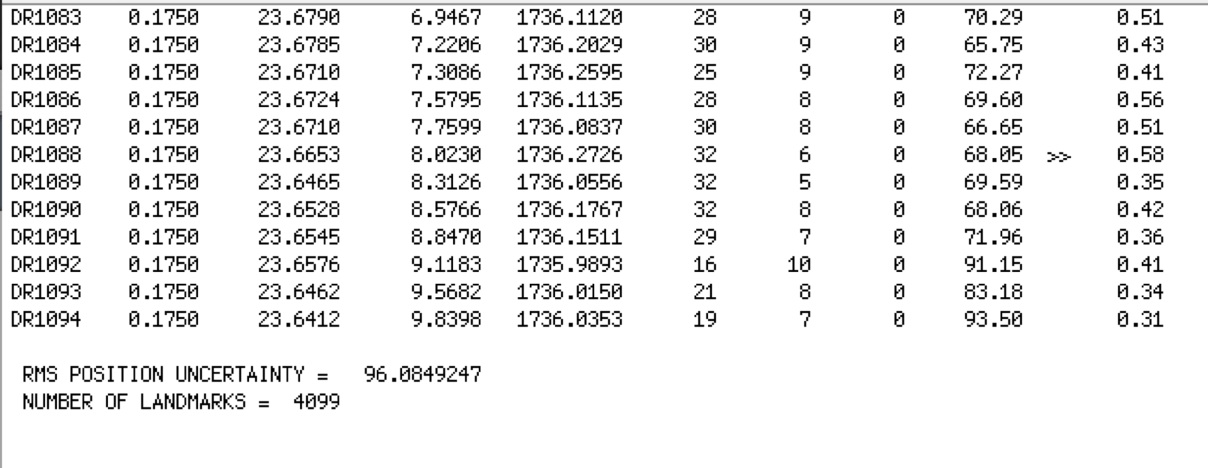
Control Points
- Inputs are weights for S/C uncertainties from measurement uncertainties and from a-prior shape constraints
Control points solution results in a 3x3 output covariance for each control point. Diagonal elements are uncertainties along maplet coord. system axes, i.e. two horizontal directions & height. Typically SPC produces comparable horizontal & height uncertainties. Results are summarized as a scalar standard deviation per degree of freedom in meters
- Residuals check automatically flags errors beyond certain input values in dump file for ease of inspection
Example

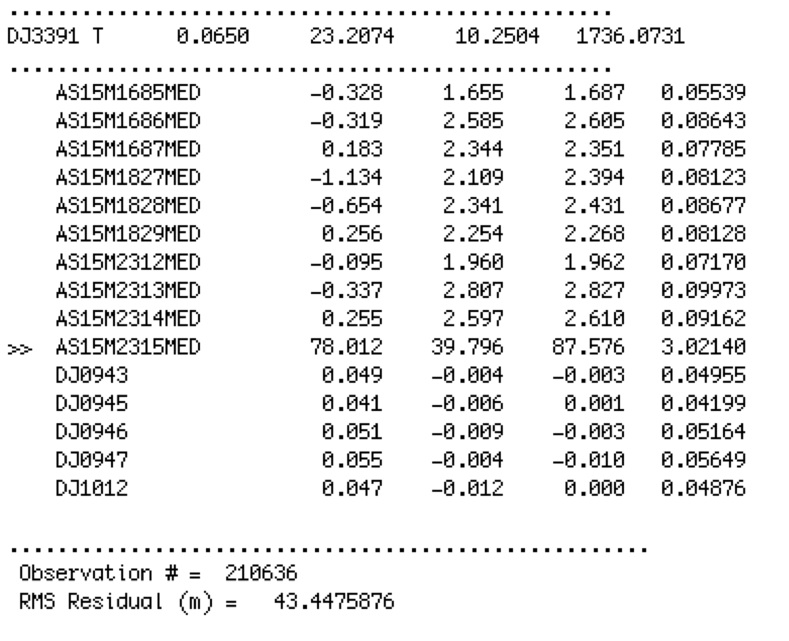
Image Residuals
- The post-fit residuals between predicted and actual control point positions in all images are captured in the residuals file
- The post-fit residuals between predicted and actual control point difference between adjacent, overlapping maplets are captured in the residuals file
- Outliers in both quantities are flagged automatically based on input threshold criteria
Example

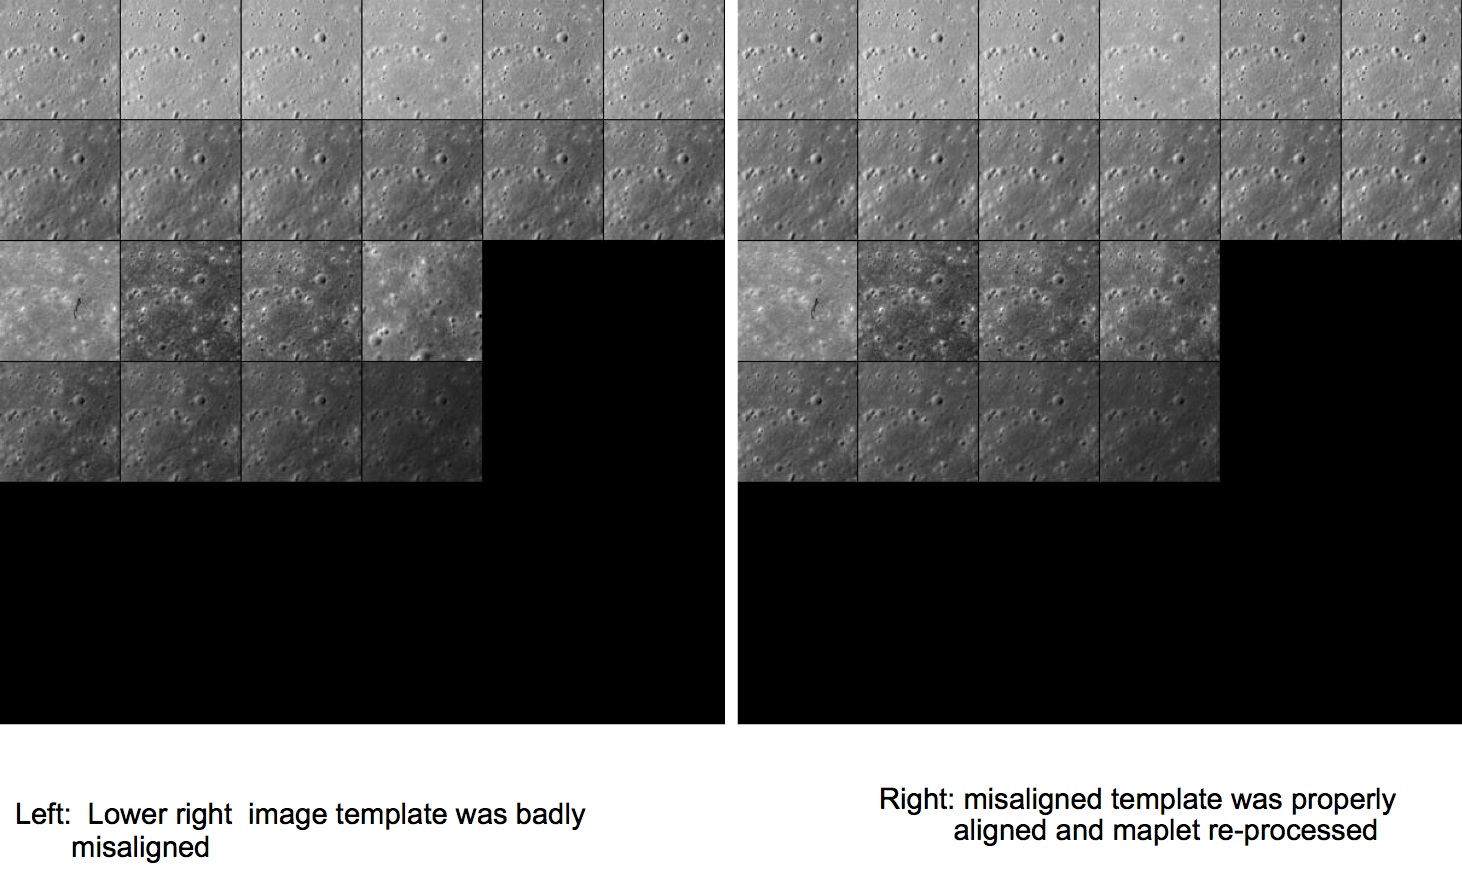
Bad & Fixed Image

Qualitative Checks
- Qualitative checks are important to verify that the quantitative error estimates are believable
Render a single maplet, or a DEM synthesized by a collection of maplets, at the same geometry & illumination conditions as the images themselves
- Do all the features in the images appear in the DEM ?
- Are the smallest discernible features in the images, e.g., boulders, craters etc. visible in the DEM as well ?
- Is the relative albedo solution such that the relative brightness of adjacent image features matches that of the DEM ?
- Are the heights solution such that the length and overall appearance of the shadows in the DEM matches that of the image ?
How are Uncertainties Introduced in the Data
- Main types of uncertainties:
- S/C trajectory, camera pointing, image timestamp
- Manifest themselves mostly in the projection of image template onto the surface. Corrected by global geometry solution
- Image noise, artifacts, smear, overall image quality
- Manifest themselves in predicted image template brightness and in its fit to the extracted image brightness
- Photometric model and reflectance function models
Show up in slopes & heights integration
Poor choice of a-priori parameters & data weights
- Evident at end of each estimation step; data won’t fit well
- S/C trajectory, camera pointing, image timestamp
- Often above contributions are correlated; individual contributors may not be separated until many processing steps have been taken
