Spacecraft Azimuth Variations
Aim and Objectives
Purpose of Test 11: To evaluate SPC's ability to represent a simplified 'boulder' which has a constant 20 degree slope.
Objective for Tests 11 F, G, H, I & J, Spacecraft Azimuth Variations
- To investigate the effect of varying the combination of spacecraft azimuths with respect to a landmark contained in the image suite;
- To investigate the effect of the number of images and viewing conditions.
Methodology
The 'boulder' was simulated by generating a simple axi-symmetric, flat-topped cone (peak) with a constant 20 degree slope. Multiple peaks and (simplified) craters are randomly placed in an otherwise flat landscape of width approx. 22.5m.
Entire Truth map: REGION.MAP
Bigmaps
The following TAG1 bigmaps were tiled/iterated and evaluated:
Starting topography defined from: START1.MAP at pixel/line location 49, 49 (= REGION.MAP at p/l 1125, 1125).
Step |
GSD |
Overlap Ratio |
Q Size |
Width |
Center |
START.MAP |
20cm |
- |
49 |
20m |
REGION.MAP p/l 1125, 1125 (center) |
10cm-Tiling |
10cm |
1.3 |
130 |
20m |
START1.MAP, p/l 49, 49 |
5cm-Tiling |
5cm |
1.3 |
250 |
20m |
START1.MAP, p/l 49, 49 |
5cm-Iterations |
5cm |
- |
- |
20m |
START1.MAP, p/l 49, 49 |
Portion Truth Map (011TRU.MAP) |
1cm |
- |
200 |
4m |
REGION.MAP, p/l 996, 1005 |
Tiling/Iteration Parameters
Auto-Elimination Parameters: |
0, 60, .25, .25, 0, 3 |
Reset albedo/slopes |
NO |
Determine Central Vector |
YES |
Differential Stereo |
YES |
Shadows |
YES |
Tiling seed files: t11-10.seed , t11-05.seed
Iteration seed file : Piteate2StSh-woAYY
Data
- Data was generated by Eric.
- Image resolutions: 2cm/pixel.
Viewing Conditions
Name |
Sun |
S/C Az |
S/C Zenith |
Total Number of Images |
Test11F |
45, 0, -45 |
every 20 |
45 |
72 |
Test11G |
45, 0, -45 |
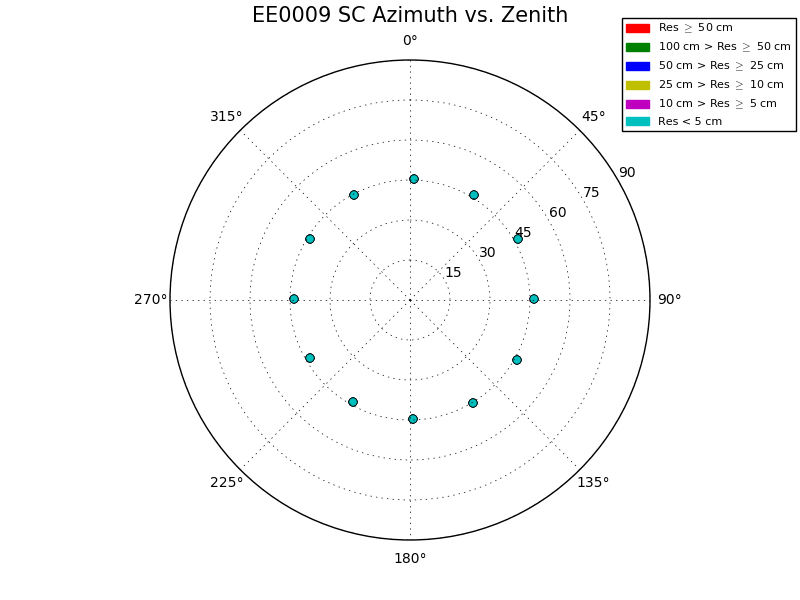
every 30 |
45 |
48 |
Test11H |
45, 0, -45 |
every 45 |
45 |
32 |
Test11I |
45, 0, -45 |
every 60 |
45 |
24 |
Test11J |
45, 0, -45 |
every 90 |
45 |
16 |
Test 11F Viewing Conditions
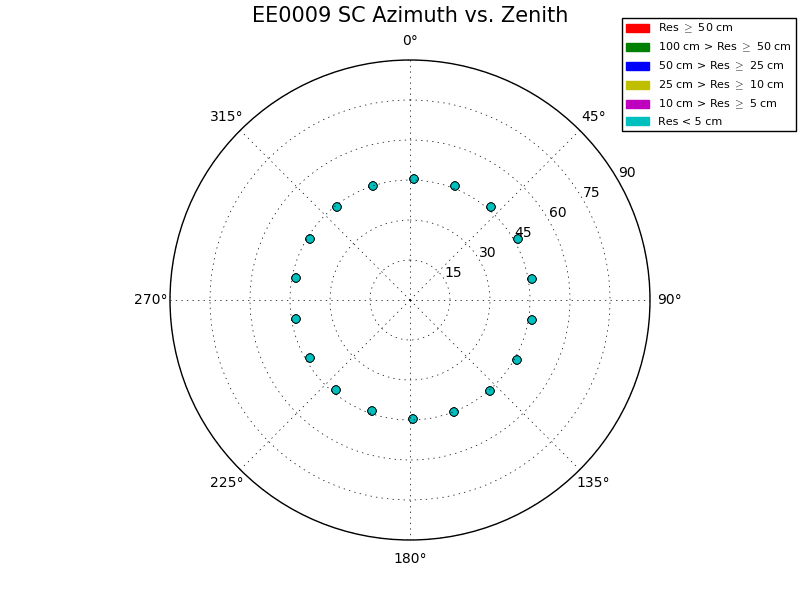
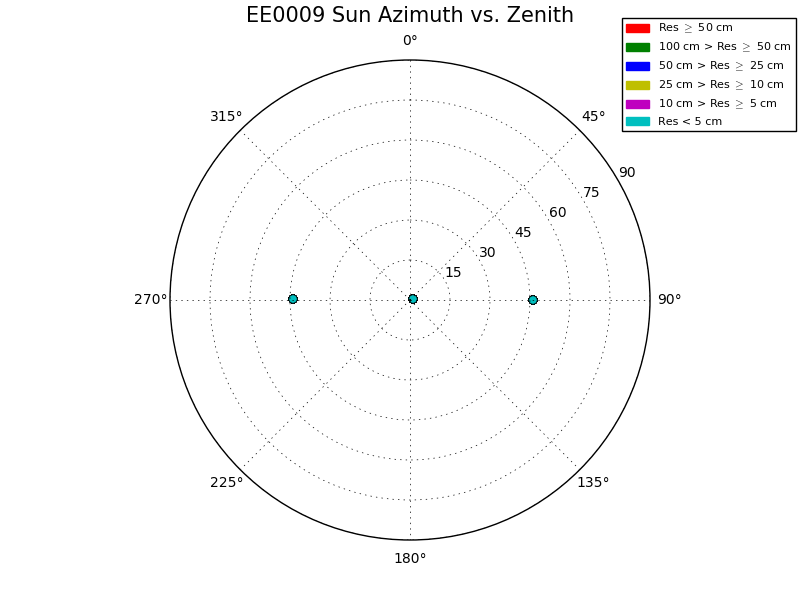
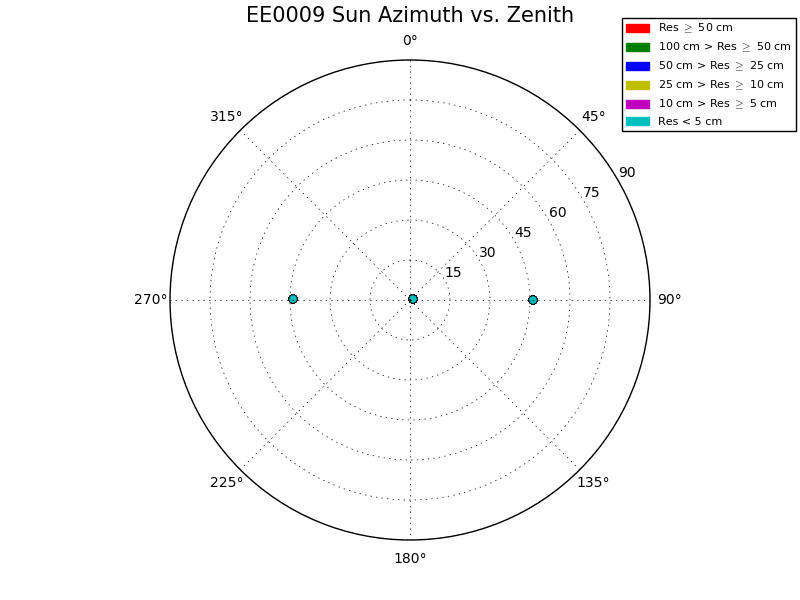
Test 11G Viewing Conditions
Test 11H Viewing Conditions
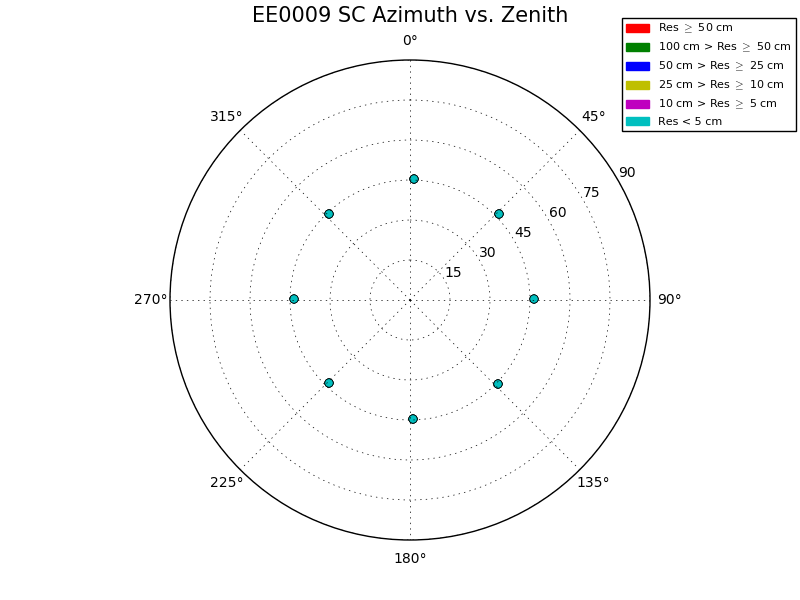
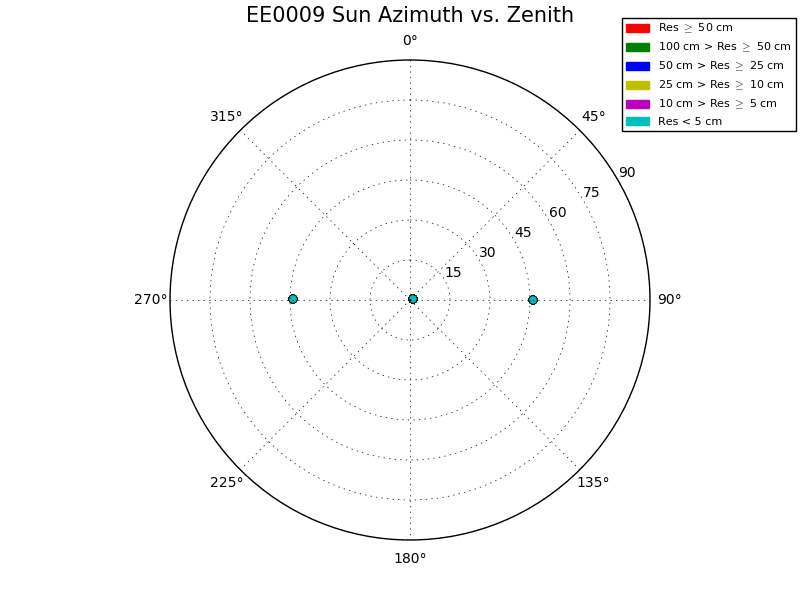
Test 11I Viewing Conditions
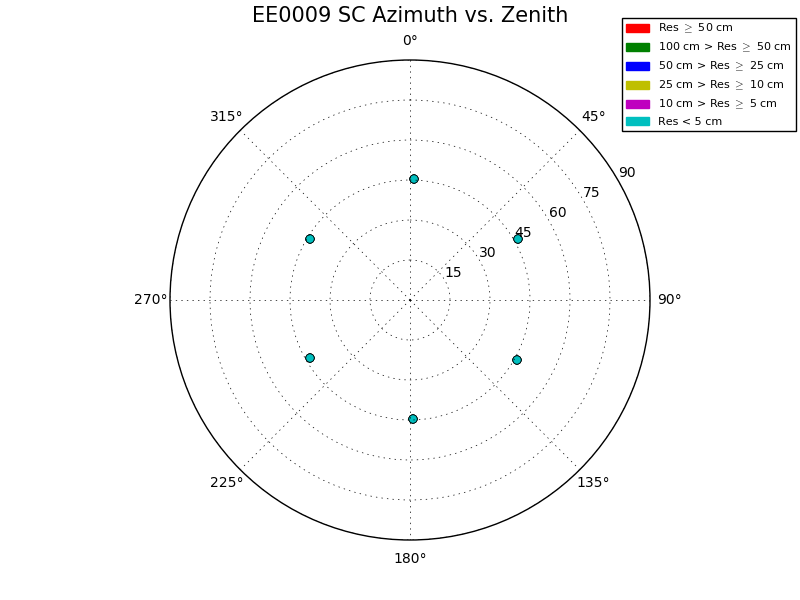
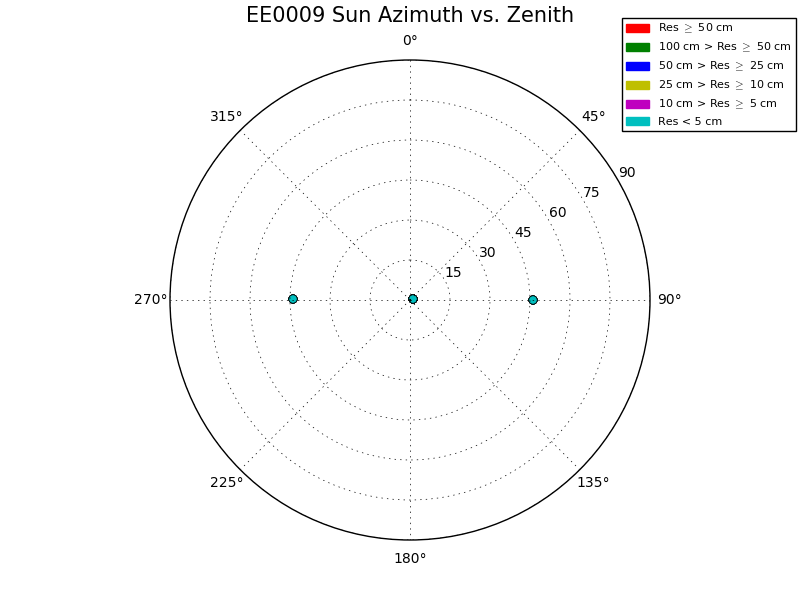
Test 11J Viewing Conditions
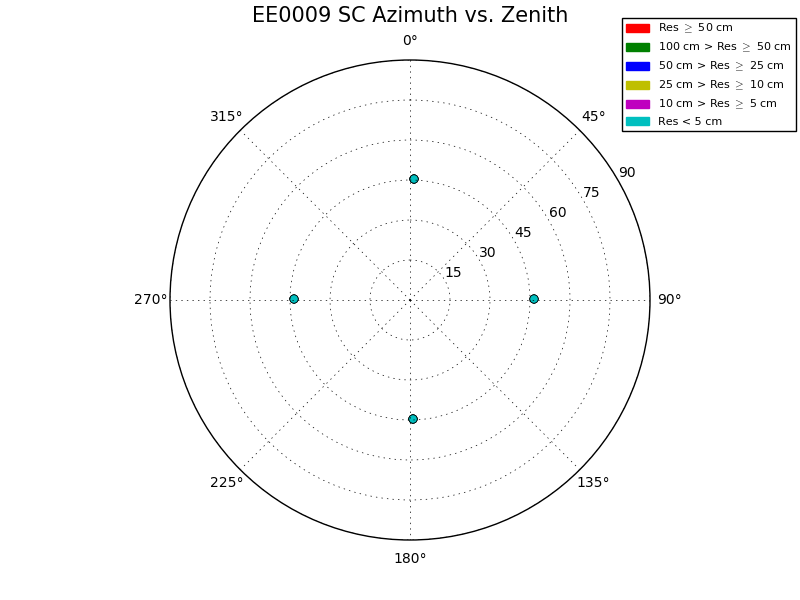
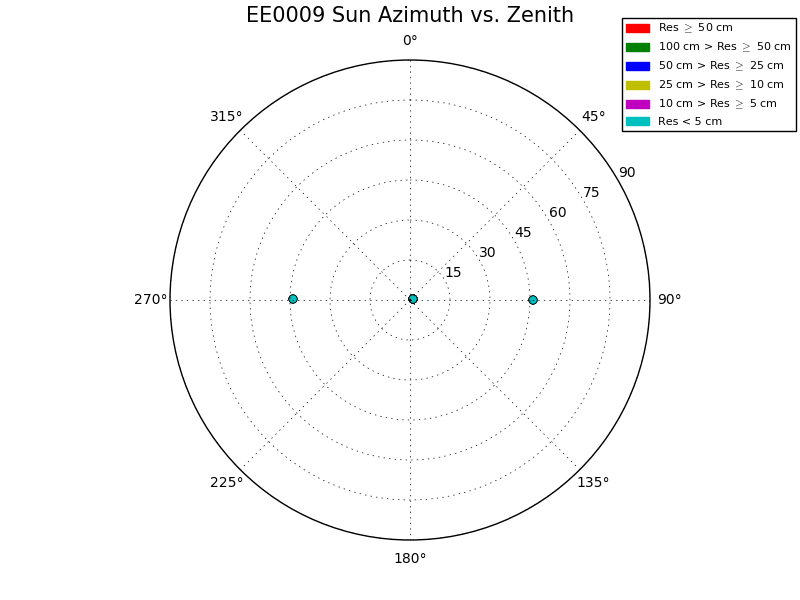
Results ( All with overlaps)
Test Over11FGHIJ Comparative Results
IMPORTANT Note: The heat maps are made from CompMapVec where optimal translation and rotation is not used.
Heat Maps Discussion
Observing the heat maps show a clear tilt that is present since one side of the Effort's bigamp topography is always lower than the Truth's after the tiling step. Then, as iterations occur, SPC starts to bring the entire topography up to account for this tilt, but SPC overshoots the Truth leaving most of the Effort's topography now greater than the Truth. The heat maps also indicate the iterations where the Effort's topography best matches the Truth; which are 10 ,20, 20, 30, and 30 for Tests F, G, H, J , and I respectfully. This completely agrees with Figure 1 in the Test Over11FGHIJ Comparative Results Section.
