Spacecraft Zenith Variations
Aim and Objectives
Purpose of Test 11: To evaluate SPC's ability to represent a simplified 'boulder' which has a constant 20 degree slope.
Objective for Test 11 S, T & U, Spacecraft Zenith Variations
- To investigate the effect of varying the combination of spacecraft zenith (emission angle) contained in the image suite;
- To investigate the effect of the number of images and viewing conditions.
Methodology
The 'boulder' was simulated by generating a simple axi-symmetric, flat-topped cone (peak) with a constant 20 degree slope. Multiple peaks and (simplified) craters are randomly placed in an otherwise flat landscape of width approx. 22.5m.
Truth map: REGION.MAP
Bigmaps
The following TAG1 bigmaps were tiled/iterated and evaluated:
Starting topography defined from: START1.MAP at pixel/line location 49, 49 (= REGION.MAP at p/l 1125, 1125).
Step |
GSD |
Overlap Ratio |
Q Size |
Width |
Center |
START.MAP |
20cm |
- |
49 |
20m |
REGION.MAP p/l 1125, 1125 (center) |
10cm-Tiling |
10cm |
1.3 |
130 |
20m |
START1.MAP, p/l 49, 49 |
5cm-Tiling |
5cm |
1.3 |
250 |
20m |
START1.MAP, p/l 49, 49 |
5cm-Iterations |
5cm |
- |
- |
20m |
START1.MAP, p/l 49, 49 |
Evaluation Map |
1cm |
- |
200 |
4m |
REGION.MAP, p/l 996, 1005 |
Tiling/Iteration Parameters
Auto-Elimination Parameters: |
0, 60, .25, .25, 0, 3 |
Reset albedo/slopes |
NO |
Determine Central Vector |
YES |
Differential Stereo |
YES |
Shadows |
YES |
Tiling seed files: t11-10.seed , t11-05.seed
Iteration seed file : Piteate2StSh-woAYY
Data
- Data was generated by ??.
- Image resolutions: 2cm/pixel.
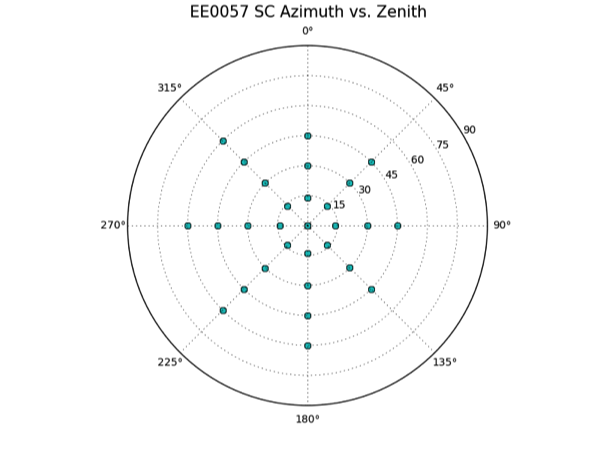
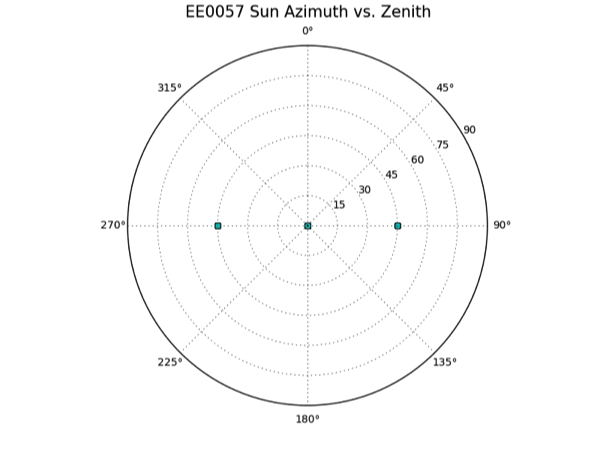
Viewing Conditions
Name |
Sun |
S/C Az |
S/C Zenith |
Total Number of Images |
Test11S |
45, 0, -45 |
every 45 |
0, 30, 60 |
80 |
Test11T |
45, 0, -45 |
every 45 |
0, 20, 40, 60 |
112 |
Test11U |
45, 0, -45 |
every 45 |
0, 15, 30, 45, 60 |
144 |
Note that a larger image suite was planned and produced than was utilized during test. The images for a number of planned viewing conditions were eliminated due to image quality related to the viewing conditions being unfit for SPC. For further details are contained here:
Test11STU Unsuitable Viewing Conditions.
Test11S Viewing Conditions
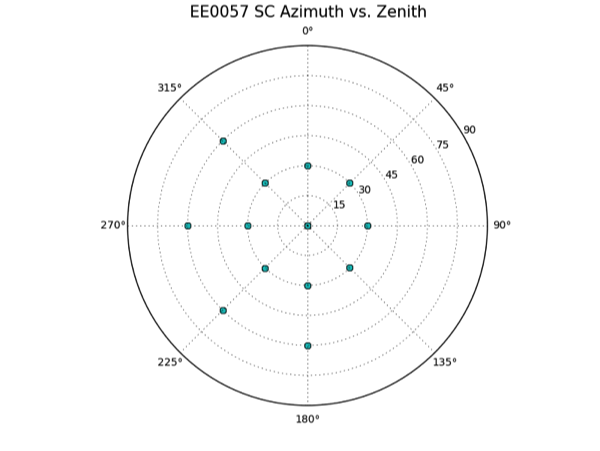
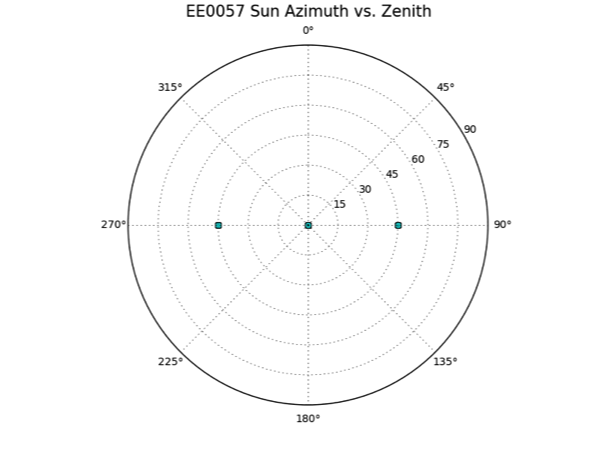
Test11T Viewing Conditions
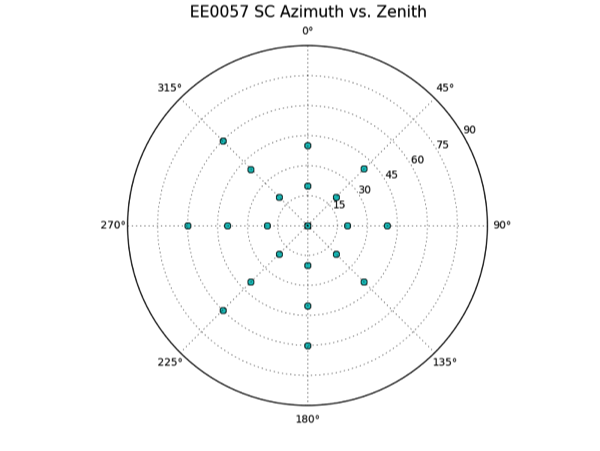
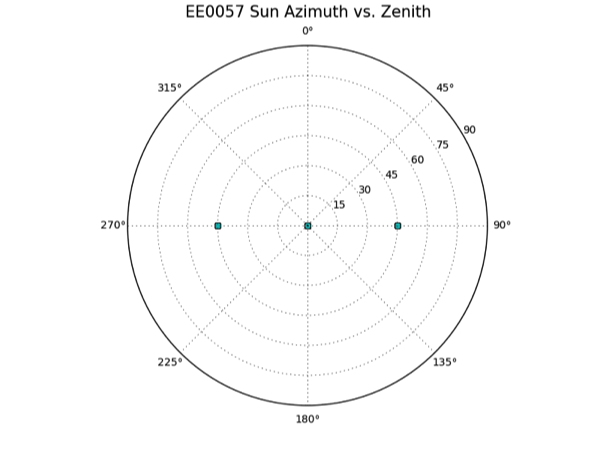
Test11U Viewing Conditions
Results
Results with Overlaps:
Test Over11STU Comparative Results
Results without Overlaps:
Discussion
Test 11 S, T and U with Overlaps
Minima
From an inspection of the minimum formal uncertainty, CompMapVec RMS and CompareOBJ RMS (both the minimum value and the number of iterations at which the minimum occurs), for tests S, T and U, the following is apparent.
Within-measure range of minima |
|
Formal Uncertainty |
1.312 +/- 0.032 cm |
CompMapVec RMS |
0.875 +/- 0.325 cm |
CompareOBJ RMS |
0.938 +/- 0.097 cm |
CompareOBJ with Optimal Trans & Rot |
0.435 +/- 0.072 cm |
- All minima were below the image resolution (2cm).
- Formal uncertainties display a negative trend, maintaining a value of approx. 3.1cm for the first 13 iterations, decreasing through 13 to 50 iterations and seemingly forming an asymptote at approx. 1.4cm after aprox. 55 iterations.
- Despite the continuing decrease in formal uncertainties, the CompareOBJ RMSs achieve their minima around 1.0cm within the first 10 to 30 iterations and then diverge, increasing monotonically with iterating and possibly beginning to round off at 2.2cm, a worse value than that achieved with the corresponding tiling step and one which is peeking above the image resolution.
- With optimal translation and rotation, however, CompareOBJ achieves the minimum values around 0.5cm within 5 to 20 iterations. Increase in RMS is small with further iteration, remaining below 0.7cm. Such differing behavior between Compare OBJ RMS with and without optimal translation and rotation indicates that tilting and drifting behavior must be inspected.
- Compare OBJ RMSs with and without optimal translation and rotation vary across tests by less than 0.2cm.
Test U achieves either the minimum value or within 0.03 cm of the minimum value for every RMS measure in the least number of iterations: 5 to 15 iterations sooner than Test T; and 15 to 20 iterations sooner than Test S (excluding Test S - CompMapVec RMS which never improved with iteration).
Test S consistently gives the largest RMS, with CompMapVec RMS showing no improvement from iterating.
Performance
All RMSs were lower than the image resolution (2cm) immediately after the 5 cm tiling. RMSs increased with iteration with CompMapVec RMS passing 2cm at 35 iterations (test S) and 81 iteration (test T), and CompareOBJ RMSs passing 2cm at 85 iterations (test S) and 92 iterations (test T). All formal uncertainties were lower than the image resolution after 40 iterations. No tests appeared to 'fail' in terms of formal uncertainty or RMS; each of the solutions would be deemed acceptable, at or below the image resolution.
Heat plots and transits show that for the first 50 iterations all solutions are very good around the edge of the peak's flat top, but after 50 iterations the entire bigmap drifts upwards, away from the truth topography. SPC struggles to model the sharp edge around the base of the peak. Before iterations are performed (bigmap is tiled at 5cm GSD), a trough has formed around the base of the peak. The trough immediately disappears when iterations begin and the map shows a simple first order behavior in the transition from flat landscape to the sloped sides of the peak. SPC models the 20 degree slope on the sides of the peak well, even though the solution drifts upwards and away from the truth topography.
Tilt
Tilt and vertical drift of the evaluation area is apparent in all tests and consistent in direction and magnitude across tests.
Before iterations begin, the North and West edges of the evaluation bigmap are low compared to the truth. South and East edges are on or below the truth.
Iterations 1 to 40:
The tilt worsens from the start of iteration to iteration 40 with the bigmap surface low on the North and West edges and high on the South and East edges. After 40 iterations:
- the surface immediately West of the peak is approximately 1cm below truth;
- the surface immediately East of the peak approximately 1cm above truth;
- the surface immediately North of the peak is approximately equal with truth;
- the surface immediately South of the peak is approximately 2cm above truth.
The heat plots show that the tilt is broadly West-East with West tilting downwards and East tilting upwards. The mechanism driving the tilt appears to be the heightening of the South and East edges, although the entire bigmap increases in height through the iterations.
Iterations 41 to 100:
The tilt decreases through the remainder of the iterations, with the North and West edges increasing in height, reaching and then surpassing the height of the North and West edges of the truth topography. By 100 iterations, there is no discernible tilt remaining in the solution, but the entire solution is 2-4cm higher than the truth topography.
Test 11 S, T and U without Overlaps
Without overlaps, the solution, contained on a single maplet, tilts drastically and CompMapVec and CompOBJ RMSs (without optimal translation or rotation) give much larger and less stable values. The direction of tilt is not consistent across tests. This could indicate that this tilting behavior differs in some way to the tilting observed in the tests with overlaps.
Final Remarks on Tilt
Differences in the tilting behavior observed between the tests with and without overlaps may indicate different mechanisms involved in causing the solution to tilt. The tilting observed in the test without overlaps could indicate simple random drift of the solution. The tilting observed in the tests with overlaps may point to the overlaps as a source of tilt. Considering that maplets and their overlaps are solved in broad terms starting from the North-West corner and finishing at the South-East corner of the tiled area, it is possible that the order in which maplets are iterated is affecting the solution. Two approaches to investigating this would be to iterate maplets in random order and to evaluate maplets in reverse-order and compare the iterated solutions. The setup up of these tests would be relatively straight-forward, but iterating the solutions takes a significant amount of time, for example 2 hours of processing per iteration for test U.
Conclusion
Although differences in performance were apparent across the spacecraft zenith variations, each test gave an acceptable solution. It would therefore appear that the combination of spacecraft zenith conditions is not a critical consideration in planning the image suite, as long as basic good practice for obtaining a good SPC image suite is followed.
Tilting and vertical drift of the DTM has however been observed across tests and this is a source of concern regarding the fidelity of the solution.
