|
Size: 2968
Comment:
|
Size: 6814
Comment:
|
| Deletions are marked like this. | Additions are marked like this. |
| Line 5: | Line 5: |
| '''Purpose of test:''' . | '''Purpose of Test 11:''' To evaluate SPC's ability to represent a simplified 'boulder' which has a constant 20 degree slope. |
| Line 7: | Line 7: |
| '''Additional Objectives''' * . |
'''Objective for Test 11 S, T & U, Spacecraft Zenith Variations''' * To investigate the effect of varying the combination of spacecraft zenith (emission angle) contained in the image suite; * To investigate the effect of the number of images and viewing conditions. |
| Line 12: | Line 13: |
| '''Data''' * Data was generated by . * Location and parameters for evaluation area. * Image Suite: Image resolutions: 50cm, 20cm, 10cm, 5cm. * emission * . * incidence * . * . |
The 'boulder' was simulated by generating a simple axi-symmetric, flat-topped cone (peak) with a constant 20 degree slope. Multiple peaks and (simplified) craters are randomly placed in an otherwise flat landscape of width approx. 22.5m. |
| Line 22: | Line 15: |
| || Name || Sun || S/C Az || S/C Zenith || || Test11S || 45, 0, -45 || every 45 || 0, 30, 60 || || || Test11T || 45, 0, -45 || every 45 || 0, 20, 40, 60, 80 || || || Test11U || 45, 0, -45 || every 45 || 0, 14, 30, 45, 60, 75 || || Spacecraft: {{attachment:SC_perfectF2_POLARS.jpg||width=300}} Sun: {{attachment:SUN_perfectF2_POLARS.jpg||width=300}} |
'''Truth map:''' REGION.MAP |
| Line 40: | Line 21: |
| Starting topography defined from: ? | Starting topography defined from: START1.MAP at pixel/line location 49, 49 (= REGION.MAP at p/l 1125, 1125). |
| Line 42: | Line 23: |
| ||Step||GSD||Overlap Ratio||Q Size||Width|| ||35cm-Tiling|| ||18cm-Tiling|| ||9cm-Tiling|| ||5cm-Tiling|| |
||Step||GSD||Overlap Ratio||Q Size||Width||Center|| ||START.MAP||20cm||-||49||20m||REGION.MAP p/l 1125, 1125 (center)|| ||10cm-Tiling||10cm||1.3||130||20m||START1.MAP, p/l 49, 49|| ||5cm-Tiling||5cm||1.3||250||20m||START1.MAP, p/l 49, 49|| ||5cm-Iterations||5cm||-||-||20m||START1.MAP, p/l 49, 49|| ||Evaluation Map||1cm||-||200||4m||REGION.MAP, p/l 996, 1005|| |
| Line 48: | Line 30: |
| '''Tiling/Iteration Parameters''' | |
| Line 49: | Line 32: |
| '''Iteration Parameters''' | ||Auto-Elimination Parameters:||0, 60, .25, .25, 0, 3|| ||Reset albedo/slopes||NO|| ||Determine Central Vector||YES|| ||Differential Stereo||YES|| ||Shadows||YES|| |
| Line 51: | Line 38: |
| Reset albedo/slopes: ?YES | '''Tiling seed files:''' [[Test Over11STU t11-10.seed|t11-10.seed]] , [[Test Over11STU t11-05.seed|t11-05.seed]] |
| Line 53: | Line 42: |
| Calculate Central Vector: ?YES | '''Iteration seed file :''' [[Test Over11STU Piterate2StSh-withoutayy.seed|Piteate2StSh-woAYY]] |
| Line 55: | Line 45: |
| Differential Stereo: ?YES | '''Data''' * Data was generated by ??. * Image resolutions: 2cm/pixel. |
| Line 57: | Line 49: |
| Shadows: ?NO | '''Viewing Conditions''' || Name || Sun || S/C Az || S/C Zenith || Total Number of Images || || Test11S || 45, 0, -45 || every 45 || 0, 30, 60 || 80 || || Test11T || 45, 0, -45 || every 45 || 0, 20, 40, 60 || 112 || || Test11U || 45, 0, -45 || every 45 || 0, 15, 30, 45, 60 || 144 || Note that a larger image suite was planned and produced than was utilized during test. The images for a number of planned viewing conditions were eliminated due to image quality related to the viewing conditions being unfit for SPC. For further details are contained here: [[Test11STU Unsuitable Viewing Conditions]]. '''Test11S Viewing Conditions''' {{attachment:Over11S_EE0057_sc_plot_resized.png}} {{attachment:Over11S_EE0057_sun_plot_resized.png}} '''Test11T Viewing Conditions''' {{attachment:Over11T_EE0057_sc_plot_resized.png}} {{attachment:Over11T_EE0057_sun_plot_resized.png}} '''Test11U Viewing Conditions''' {{attachment:Over11U_EE0057_sc_plot_resized.png}} {{attachment:Over11U_EE0057_sun_plot_resized.png}} |
| Line 61: | Line 77: |
| [[Test11STU Comparative Results]] | '''Results with Overlaps:''' [[Test Over11STU Comparative Results]] [[Test Over11S Results]] [[Test Over11T Results]] [[Test Over11U Results]] '''Results without Overlaps:''' |
| Line 72: | Line 98: |
| The measures of accuracy are plotted for each test in figures ?? to ?? under Tables and Figures (below). | === Test 11 S, T and U with Overlaps === |
| Line 74: | Line 100: |
| '''Figure 1: Minima''' | '''Minima''' |
| Line 76: | Line 102: |
| {{attachment:Minima-resized.png}} | From an inspection of the minimum formal uncertainty, CompMapVec RMS and CompareOBJ RMS (both the minimum value and the number of iterations at which the minimum occurs), for tests S, T and U, the following is apparent. |
| Line 78: | Line 104: |
| Figure 1 illustrates the minimum uncertainty and RMSs for each test, and at which iteration each minimum occurs. The following patterns are apparent: * Test U achieves the minimum value for every measure in the least number of iterations: 5 to 15 iterations sooner than Test T; and 15 to 20 iterations sooner than Test S (excluding Test S - CompMapVec RMS). |
||||Within-measure range of minima|| ||Formal Uncertainty||1.511 +/- 0.087 cm|| ||CompMapVec RMS||0.875 +/- 0.325 cm|| ||CompareOBJ RMS||0.938 +/- 0.097 cm|| ||CompareOBJ with Optimal Trans & Rot||0.435 +/- 0.072 cm|| * All minima were below the image resolution (2cm). * Formal uncertainties display a negative trend which appears to still be decreasing after 50 iterations. * The RMSs reached minima within the first 30 iterations and then diverged. No asymptotic behavior is apparent, the RMSs appear to worsen as testing continues to 50 iterations and beyond, although RMSs remain below the image resolution in all cases except TestS's CompMapVec RMS. * Test U consistently achieves the minimum RMS values in the least number of iterations: 5 to 15 iterations sooner than Test T; and 15 to 20 iterations sooner than Test S (excluding Test S CompMapVec RMS which never improved with iteration). |
| Line 81: | Line 115: |
| * CompareOBJ RMS (with and without optimal translation and rotation varies across tests by less than 0.2cm, although Test U consistently archives the minimum RMS in significantly fewer iterations. | * Compare OBJ RMSs with and without optimal translation and rotation vary across tests by less than 0.2cm, with optimal translation and rotation giving consistently better results in fewer iterations (5 to 10 iterations sooner in every test). |
| Line 83: | Line 117: |
| == Tables and Figures == | '''Performance''' |
| Line 85: | Line 119: |
| '''Formal Uncertainty''' | All RMSs were lower than the image resolution (2cm) after the 5 cm tiling. All formal uncertainties were lower than the image resolution after 40 iterations. No tests appeared to 'fail', each of the solutions would be deemed acceptable. |
| Line 87: | Line 121: |
| {{attachment:FormalUncertainty-resized.png}} | Heat plots and transits show that all solutions are very good around the edge of the peak's flat top. SPC struggles to model the sharp edge around the base of the peak. Before iterations are performed (bigmap is tiled at 5cm GSD), a trough has formed around the base of the peak. The trough immediately disappears when iterations begin and the map shows a simple first order behavior in the transition from slope to flat landscape. |
| Line 89: | Line 123: |
| '''CompMapVec RMS''' | '''Tilt''' |
| Line 91: | Line 125: |
| {{attachment:CompMapVec-resized.png}} | Tilting of the evaluation area is apparent in all tests. The direction of the tilt is consistent across tests. After 40 iterations: * the surface immediately West of the peak is approximately 1cm below truth; * the surface immediately East of the peak approximately 1cm above truth; * the surface immediately North of the peak is approximately equal with truth; * the surface immediately South of the peak is approximately 2cm above truth. The heat plots show that the tilt is broadly West-East with West tilting downwards and East tilting upwards. |
| Line 93: | Line 132: |
| '''CompareOBJ RMS''' | === Test 11 S, T and U without Overlaps === |
| Line 95: | Line 134: |
| {{attachment:CompareOBJRMS-resized.png}} | Without overlaps, the solution, contained on a single maplet, tilts drastically and CompMapVec and CompOBJ RMSs (without optimal translation or rotation) give much larger and less stable values. The direction of tilt is not consistent across tests. This could indicate that this tilting behavior differs in some way to the tilting observed in the tests with overlaps and may point to the overlaps as a source of tilt. |
| Line 97: | Line 136: |
| '''CompareOBJ With Opt Tran & Rot''' | == Conclusion == |
| Line 99: | Line 138: |
| {{attachment:CompOBJwOptTranRot-resized.png}} '''Traces Running North_South''' {{attachment:transitIt20200.png}} {{attachment:transitIt40200.png}} '''Traces Running West-East''' {{attachment:transposedTransitIt20200.png}} {{attachment:transposedTransitIt40200.png}} '''Heat Plots''' {{attachment:heatPlot-T11RFS-05stepB020-1cm-4m.png}} {{attachment:heatPlot-T11RFT-05stepB020-1cm-4m.png}} {{attachment:heatPlot-T11RFU-05stepB020-1cm-4m.png}} {{attachment:heatPlot-T11RFS-05stepB040-1cm-4m.png}} {{attachment:heatPlot-T11RFT-05stepB040-1cm-4m.png}} {{attachment:heatPlot-T11RFU-05stepB040-1cm-4m.png}} |
Although differences in performance were apparent across the spacecraft zenith variations, each test gave an acceptable solution. It would therefore appear that the combination of spacecraft zenith conditions is not a critical consideration in planning the image suite, as long as the basic good practice for obtaining a good SPC image suite is followed. |
Spacecraft Zenith Variations
Aim and Objectives
Purpose of Test 11: To evaluate SPC's ability to represent a simplified 'boulder' which has a constant 20 degree slope.
Objective for Test 11 S, T & U, Spacecraft Zenith Variations
- To investigate the effect of varying the combination of spacecraft zenith (emission angle) contained in the image suite;
- To investigate the effect of the number of images and viewing conditions.
Methodology
The 'boulder' was simulated by generating a simple axi-symmetric, flat-topped cone (peak) with a constant 20 degree slope. Multiple peaks and (simplified) craters are randomly placed in an otherwise flat landscape of width approx. 22.5m.
Truth map: REGION.MAP
Bigmaps
The following TAG1 bigmaps were tiled/iterated and evaluated:
Starting topography defined from: START1.MAP at pixel/line location 49, 49 (= REGION.MAP at p/l 1125, 1125).
Step |
GSD |
Overlap Ratio |
Q Size |
Width |
Center |
START.MAP |
20cm |
- |
49 |
20m |
REGION.MAP p/l 1125, 1125 (center) |
10cm-Tiling |
10cm |
1.3 |
130 |
20m |
START1.MAP, p/l 49, 49 |
5cm-Tiling |
5cm |
1.3 |
250 |
20m |
START1.MAP, p/l 49, 49 |
5cm-Iterations |
5cm |
- |
- |
20m |
START1.MAP, p/l 49, 49 |
Evaluation Map |
1cm |
- |
200 |
4m |
REGION.MAP, p/l 996, 1005 |
Tiling/Iteration Parameters
Auto-Elimination Parameters: |
0, 60, .25, .25, 0, 3 |
Reset albedo/slopes |
NO |
Determine Central Vector |
YES |
Differential Stereo |
YES |
Shadows |
YES |
Tiling seed files: t11-10.seed , t11-05.seed
Iteration seed file : Piteate2StSh-woAYY
Data
- Data was generated by ??.
- Image resolutions: 2cm/pixel.
Viewing Conditions
Name |
Sun |
S/C Az |
S/C Zenith |
Total Number of Images |
Test11S |
45, 0, -45 |
every 45 |
0, 30, 60 |
80 |
Test11T |
45, 0, -45 |
every 45 |
0, 20, 40, 60 |
112 |
Test11U |
45, 0, -45 |
every 45 |
0, 15, 30, 45, 60 |
144 |
Note that a larger image suite was planned and produced than was utilized during test. The images for a number of planned viewing conditions were eliminated due to image quality related to the viewing conditions being unfit for SPC. For further details are contained here:
Test11STU Unsuitable Viewing Conditions.
Test11S Viewing Conditions
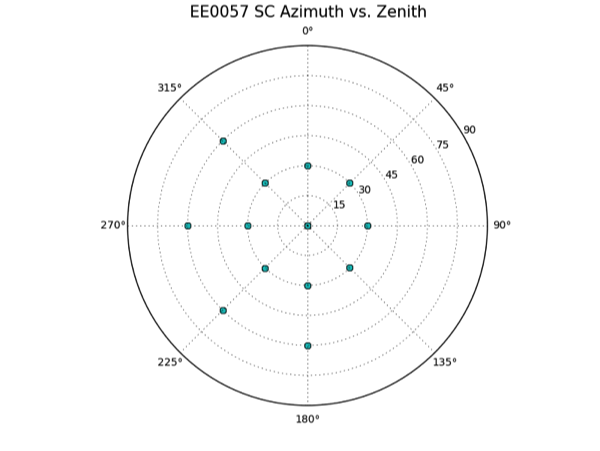
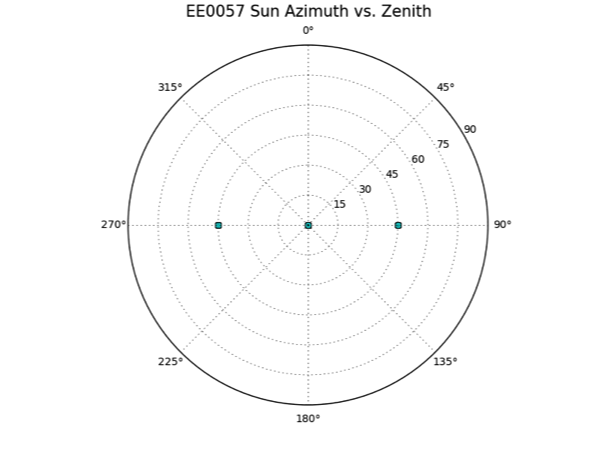
Test11T Viewing Conditions
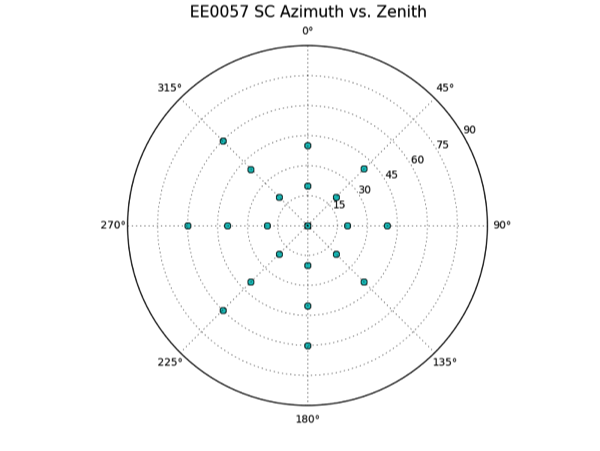
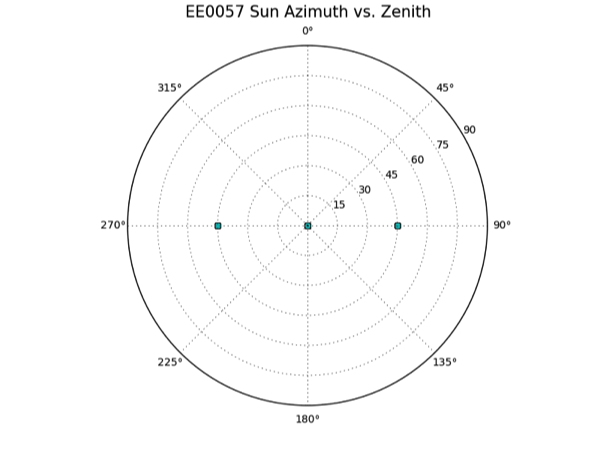
Test11U Viewing Conditions
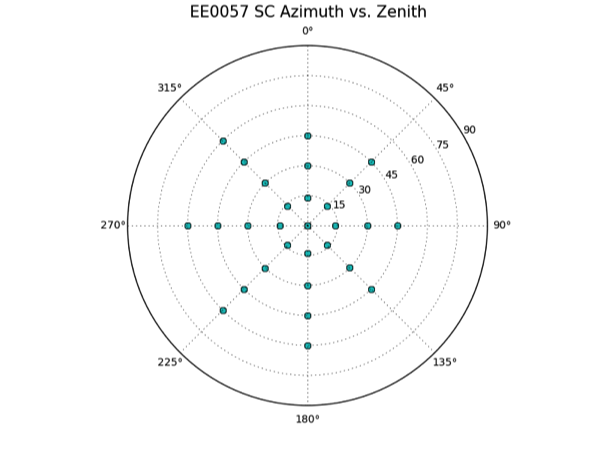
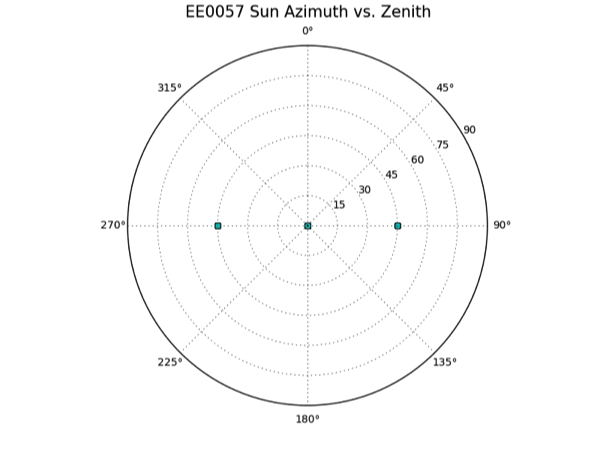
Results
Results with Overlaps:
Test Over11STU Comparative Results
Results without Overlaps:
Discussion
Test 11 S, T and U with Overlaps
Minima
From an inspection of the minimum formal uncertainty, CompMapVec RMS and CompareOBJ RMS (both the minimum value and the number of iterations at which the minimum occurs), for tests S, T and U, the following is apparent.
Within-measure range of minima |
|
Formal Uncertainty |
1.511 +/- 0.087 cm |
CompMapVec RMS |
0.875 +/- 0.325 cm |
CompareOBJ RMS |
0.938 +/- 0.097 cm |
CompareOBJ with Optimal Trans & Rot |
0.435 +/- 0.072 cm |
- All minima were below the image resolution (2cm).
- Formal uncertainties display a negative trend which appears to still be decreasing after 50 iterations.
The RMSs reached minima within the first 30 iterations and then diverged. No asymptotic behavior is apparent, the RMSs appear to worsen as testing continues to 50 iterations and beyond, although RMSs remain below the image resolution in all cases except TestS's CompMapVec RMS.
Test U consistently achieves the minimum RMS values in the least number of iterations: 5 to 15 iterations sooner than Test T; and 15 to 20 iterations sooner than Test S (excluding Test S CompMapVec RMS which never improved with iteration).
- Test S consistently gives the largest RMS but the smallest formal uncertainty.
- Compare OBJ RMSs with and without optimal translation and rotation vary across tests by less than 0.2cm, with optimal translation and rotation giving consistently better results in fewer iterations (5 to 10 iterations sooner in every test).
Performance
All RMSs were lower than the image resolution (2cm) after the 5 cm tiling. All formal uncertainties were lower than the image resolution after 40 iterations. No tests appeared to 'fail', each of the solutions would be deemed acceptable.
Heat plots and transits show that all solutions are very good around the edge of the peak's flat top. SPC struggles to model the sharp edge around the base of the peak. Before iterations are performed (bigmap is tiled at 5cm GSD), a trough has formed around the base of the peak. The trough immediately disappears when iterations begin and the map shows a simple first order behavior in the transition from slope to flat landscape.
Tilt
Tilting of the evaluation area is apparent in all tests. The direction of the tilt is consistent across tests. After 40 iterations:
- the surface immediately West of the peak is approximately 1cm below truth;
- the surface immediately East of the peak approximately 1cm above truth;
- the surface immediately North of the peak is approximately equal with truth;
- the surface immediately South of the peak is approximately 2cm above truth.
The heat plots show that the tilt is broadly West-East with West tilting downwards and East tilting upwards.
Test 11 S, T and U without Overlaps
Without overlaps, the solution, contained on a single maplet, tilts drastically and CompMapVec and CompOBJ RMSs (without optimal translation or rotation) give much larger and less stable values. The direction of tilt is not consistent across tests. This could indicate that this tilting behavior differs in some way to the tilting observed in the tests with overlaps and may point to the overlaps as a source of tilt.
Conclusion
Although differences in performance were apparent across the spacecraft zenith variations, each test gave an acceptable solution. It would therefore appear that the combination of spacecraft zenith conditions is not a critical consideration in planning the image suite, as long as the basic good practice for obtaining a good SPC image suite is followed.
