|
Size: 1930
Comment:
|
Size: 3070
Comment:
|
| Deletions are marked like this. | Additions are marked like this. |
| Line 46: | Line 46: |
| ||120||11.49||0.82||0.85|| ||140||11.62||0.84||1.07|| ||160||11.78||0.93||1.51|| ||180||11.77||0.93||1.61|| ||200||11.78||0.94||1.64|| ||220||11.77||0.92||1.64| ||240||11.78||0.95||1.66|| ||260||11.77||0.93||1.65|| ||280||11.77||0.93||1.68|| ||300||11.78||0.92||1.68|| |
|
| Line 47: | Line 57: |
| {{attachment:resultsRMS-resized.png}} | {{attachment:resultsRMS-0to300-resized.png}} |
| Line 53: | Line 64: |
| '''Traces Running North-South''' |
|
| Line 55: | Line 68: |
| {{attachment:transitPresentationIt101to200_50.png}} | |
| Line 56: | Line 70: |
| {{attachment:transitPresentationIt201to300_50.png}} '''Traces Running East-West''' {{attachment:transposedTransitPresentationIt1to100_50.png}} {{attachment:transposedTransitPresentationIt100to200_50.png}} {{attachment:transposedTransitPresentationIt200to300_50.png}} |
|
| Line 72: | Line 95: |
'''Landmark Display after 200 iterations:''' {{attachment:lmrk-display-mod-20F-200.jpg}} '''Landmark Display after 300 iterations:''' {{attachment:lmrk-display-mod-20F-300.jpg}} '''Heat Plots of CopmMapVec RMS''' {{attachment:heatPlot-mod-20F-01.png}} {{attachment:heatPlot-mod-20F-10.png}} {{attachment:heatPlot-mod-20F-50.png}} {{attachment:heatPlot-mod-20F-100.png}} {{attachment:heatPlot-mod-20F-200.png}} {{attachment:heatPlot-mod-20F-300.png}} |
Test 11F
Truth topography: flat-topped cone with 20deg slope.
Image suite: One 5cm resolution image for each Sun&S/C combination:
- Sun at 45deg, 0, -45deg; S/C at every 20deg Azimuth, 45deg Zenith.
Model bigmap parameters: GSD = 5cm, Q = 49 (width=4.9m).
Results
Note: Image auto-alignment conducted after iteration 30 and 50.
Iteration |
CompareOBJ-RMS(cm) |
CompareOBJ-RMS with Opt Trans & Rot (cm) |
CompMapVec-RMS(cm) |
Notes |
1 |
22.39 |
5.24 |
21.22 |
manual image-alignment |
2 |
19.48 |
5.57 |
18.09 |
|
3 |
17.81 |
5.11 |
16.14 |
|
4 |
16.68 |
4.74 |
14.52 |
|
5 |
15.86 |
4.45 |
13.30 |
|
6 |
15.25 |
4.19 |
12.25 |
|
7 |
14.82 |
3.97 |
11.29 |
|
8 |
14.42 |
3.77 |
10.41 |
|
9 |
14.10 |
3.61 |
9.72 |
|
10 |
13.84 |
3.45 |
9.16 |
|
11 |
13.63 |
3.27 |
8.51 |
|
12 |
13.46 |
3.11 |
8.02 |
|
13 |
13.28 |
2.96 |
7.56 |
|
14 |
13.13 |
2.81 |
7.19 |
|
15 |
13.00 |
2.68 |
6.86 |
|
16 |
12.90 |
2.54 |
6.63 |
|
17 |
12.80 |
2.40 |
6.39 |
|
18 |
12.70 |
2.28 |
6.03 |
|
19 |
12.58 |
2.15 |
5.64 |
|
20 |
12.52 |
2.02 |
5.26 |
|
30 |
12.22 |
1.29 |
3.23 |
|
31 |
12.09 |
1.23 |
2.97 |
images auto-aligned |
40 |
12.01 |
0.77 |
1.74 |
|
50 |
11.80 |
0.81 |
0.28 |
|
51 |
11.78 |
0.82 |
0.39 |
images auto-aligned |
60 |
11.69 |
0.76 |
0.33 |
|
70 |
11.42 |
0.80 |
0.29 |
|
80 |
11.42 |
0.75 |
0.48 |
|
90 |
11.39 |
0.76 |
0.63 |
|
100 |
11.40 |
0.77 |
0.70 |
|
120 |
11.49 |
0.82 |
0.85 |
|
140 |
11.62 |
0.84 |
1.07 |
|
160 |
11.78 |
0.93 |
1.51 |
|
180 |
11.77 |
0.93 |
1.61 |
|
200 |
11.78 |
0.94 |
1.64 |
||220||11.77||0.92||1.64|
240 |
11.78 |
0.95 |
1.66 |
260 |
11.77 |
0.93 |
1.65 |
280 |
11.77 |
0.93 |
1.68 |
300 |
11.78 |
0.92 |
1.68 |
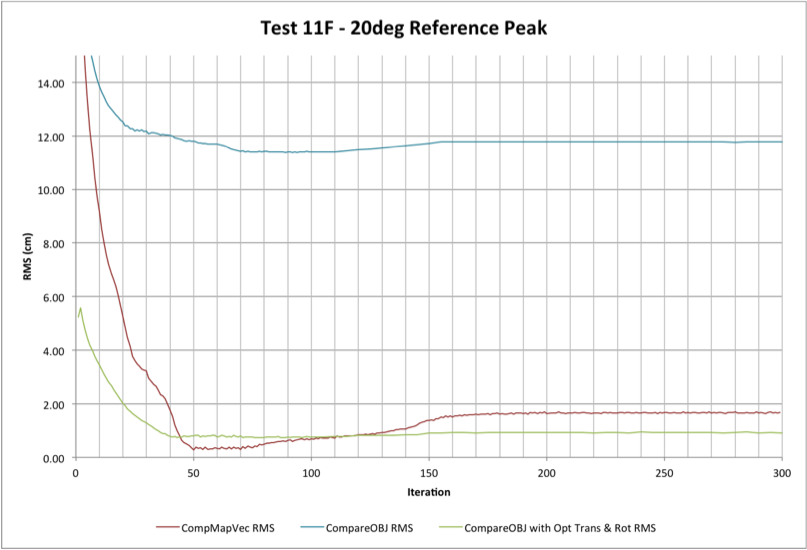
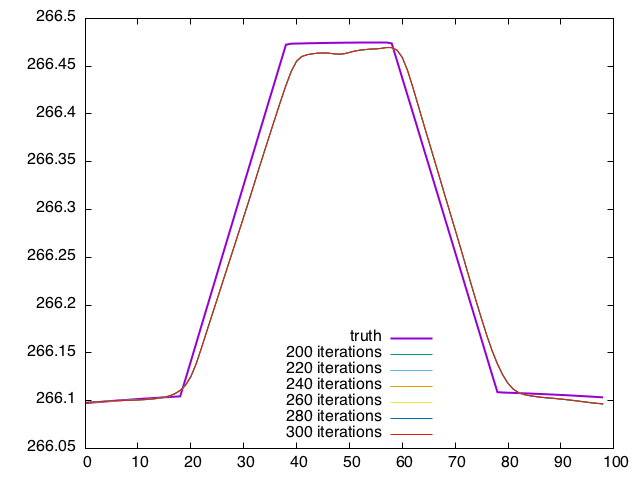
Center Traces:
Note: Image auto-alignment conducted after iteration 30 and 50.
Traces Running North-South
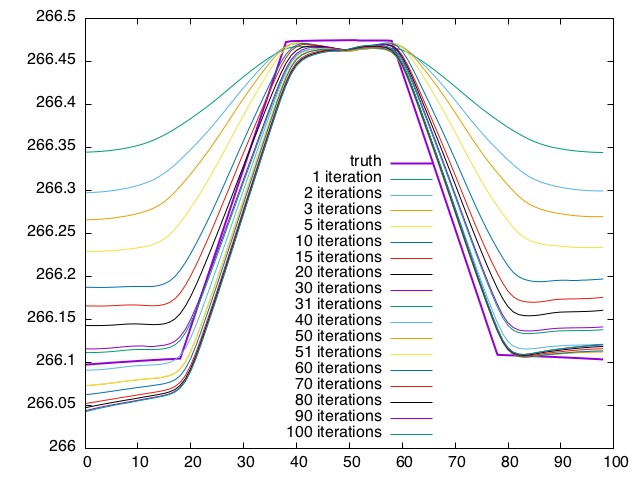
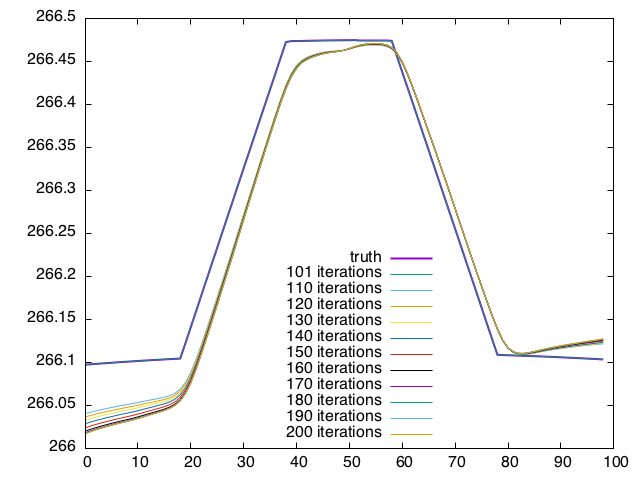
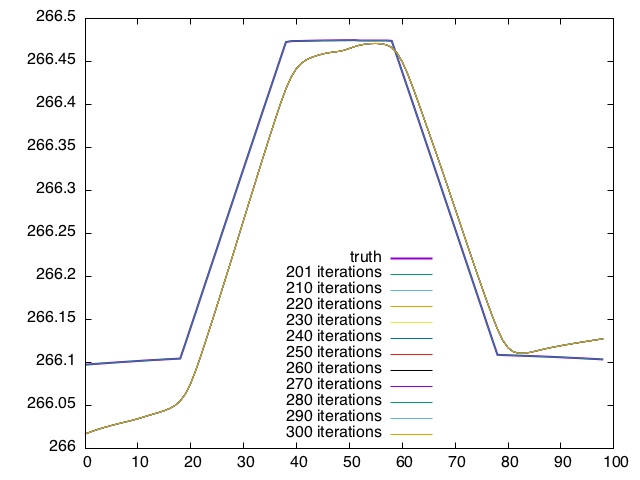
Traces Running East-West
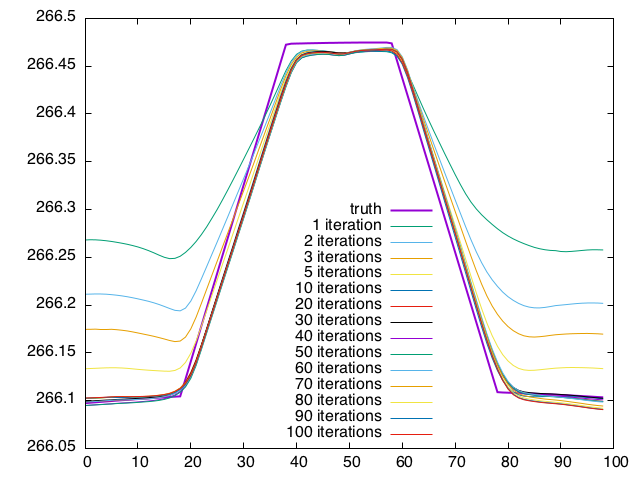
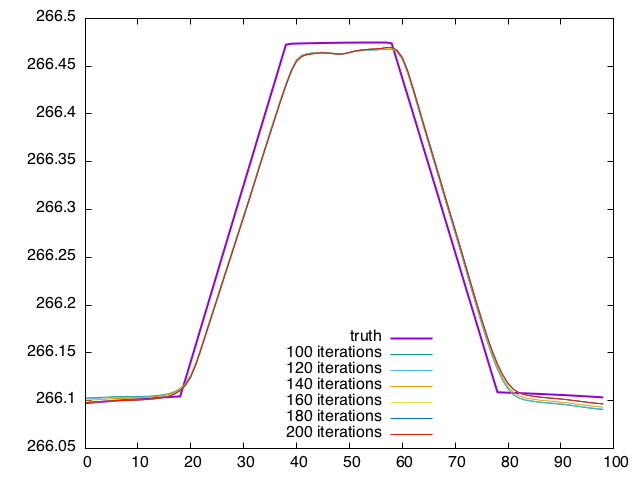
Landmark Display after 1 iteration:
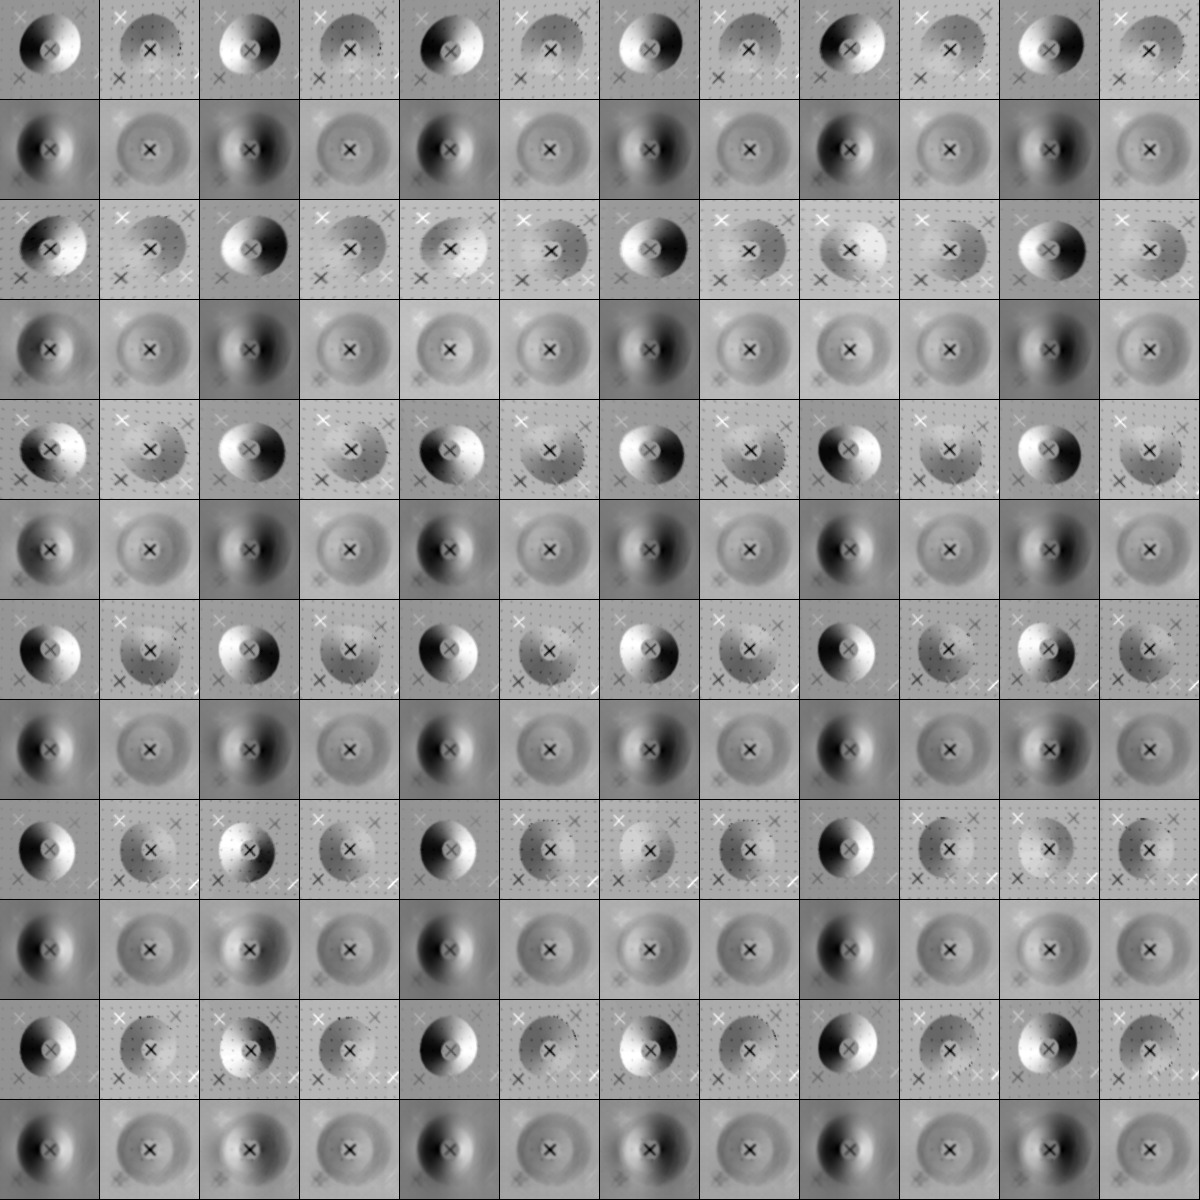
Landmark Display after 10 iterations:

Landmark Display after 50 iterations:
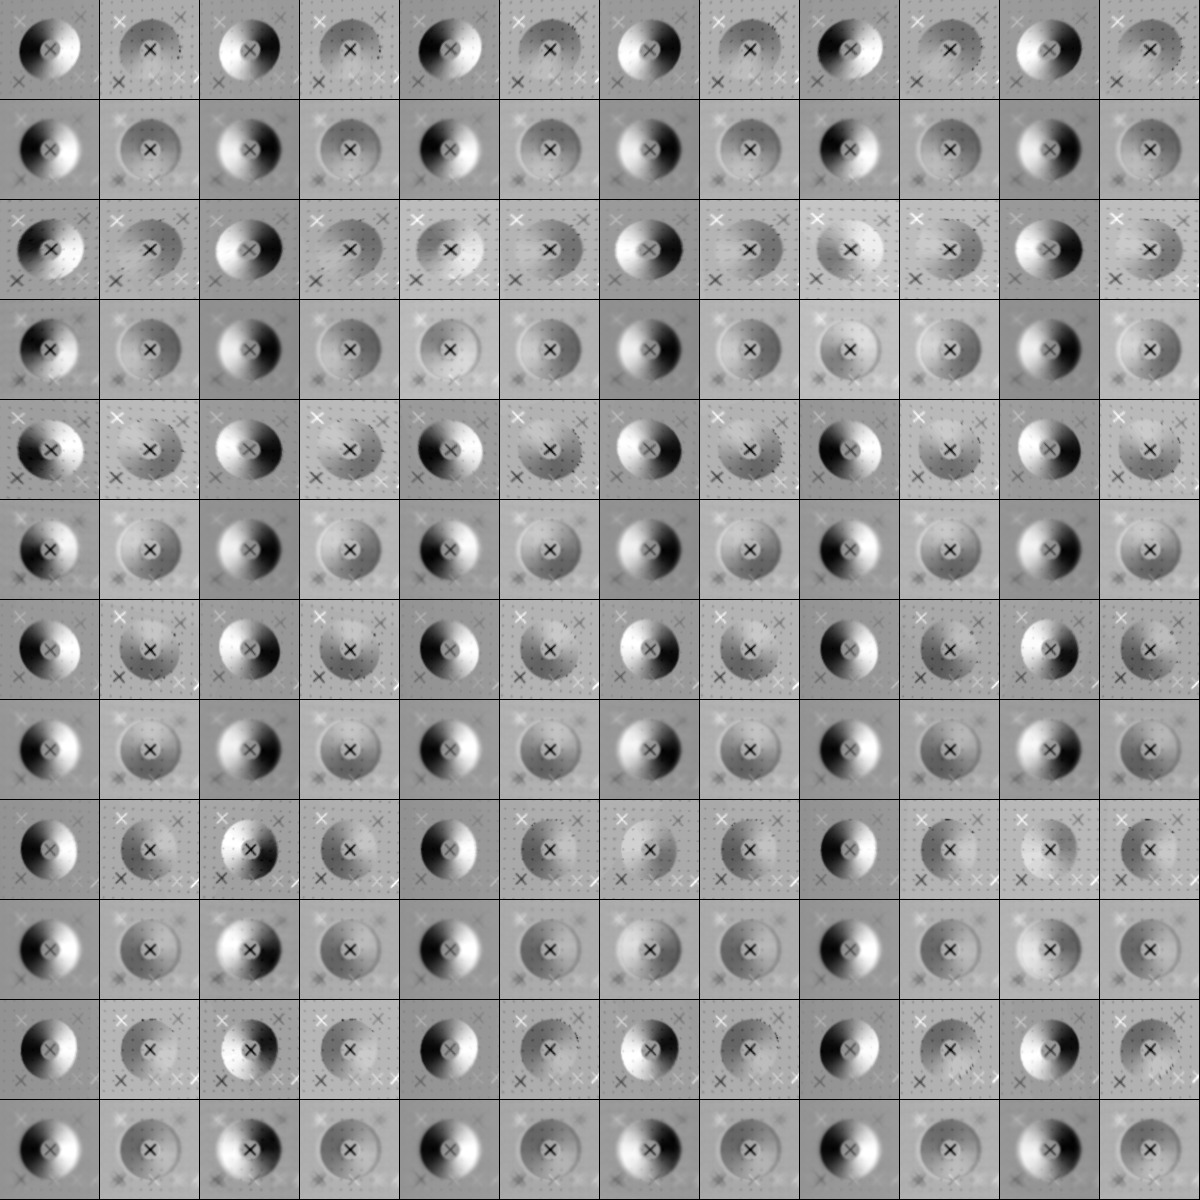
Landmark Display after 100 iterations:
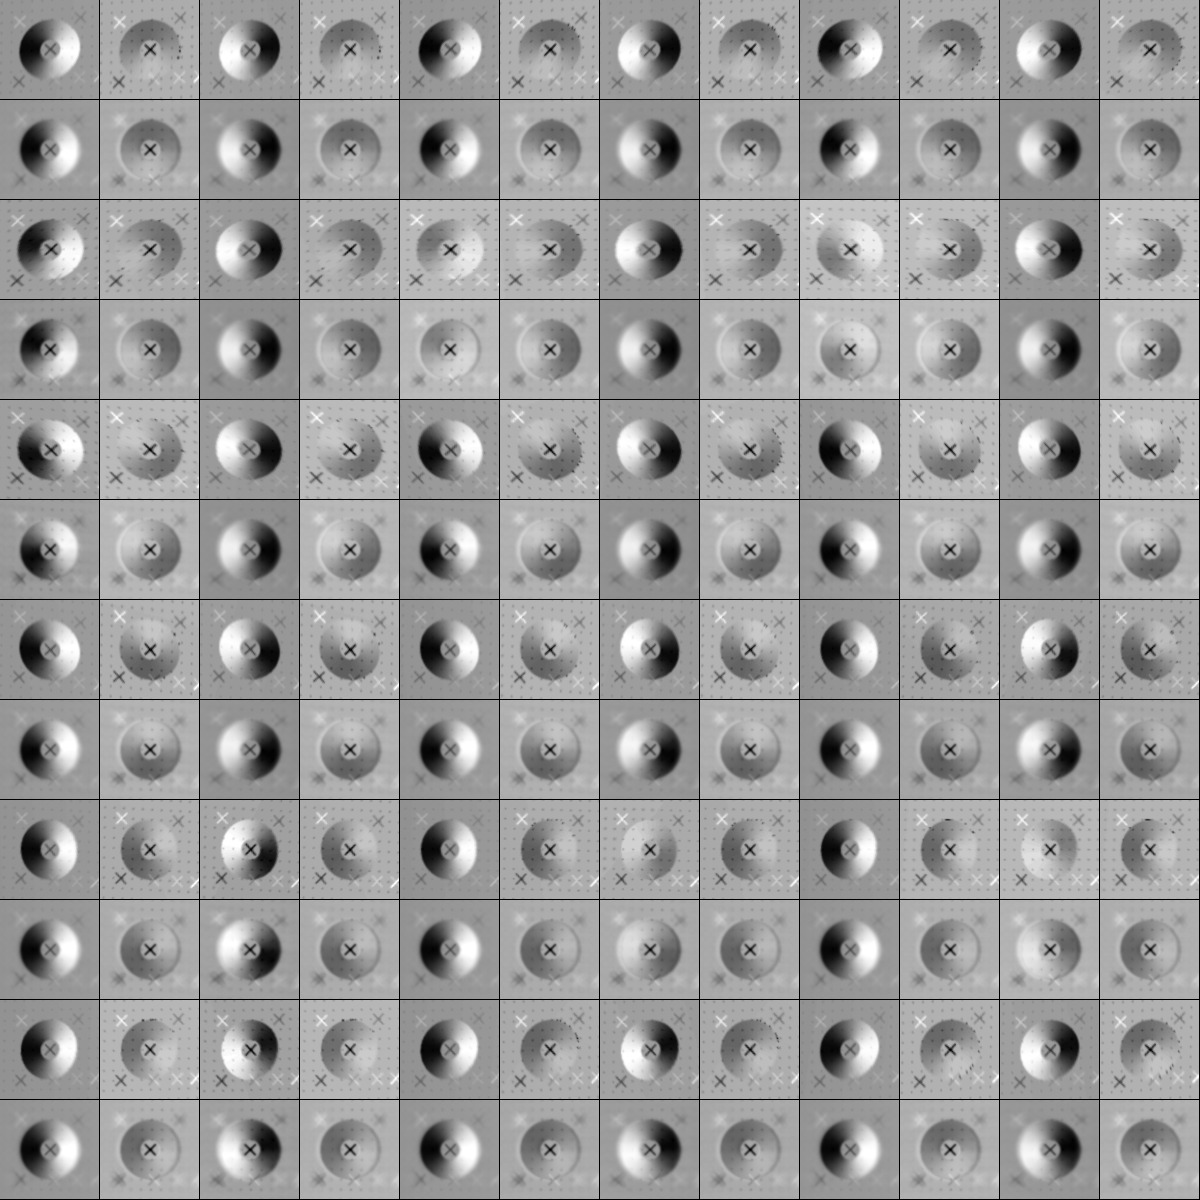
Landmark Display after 200 iterations:
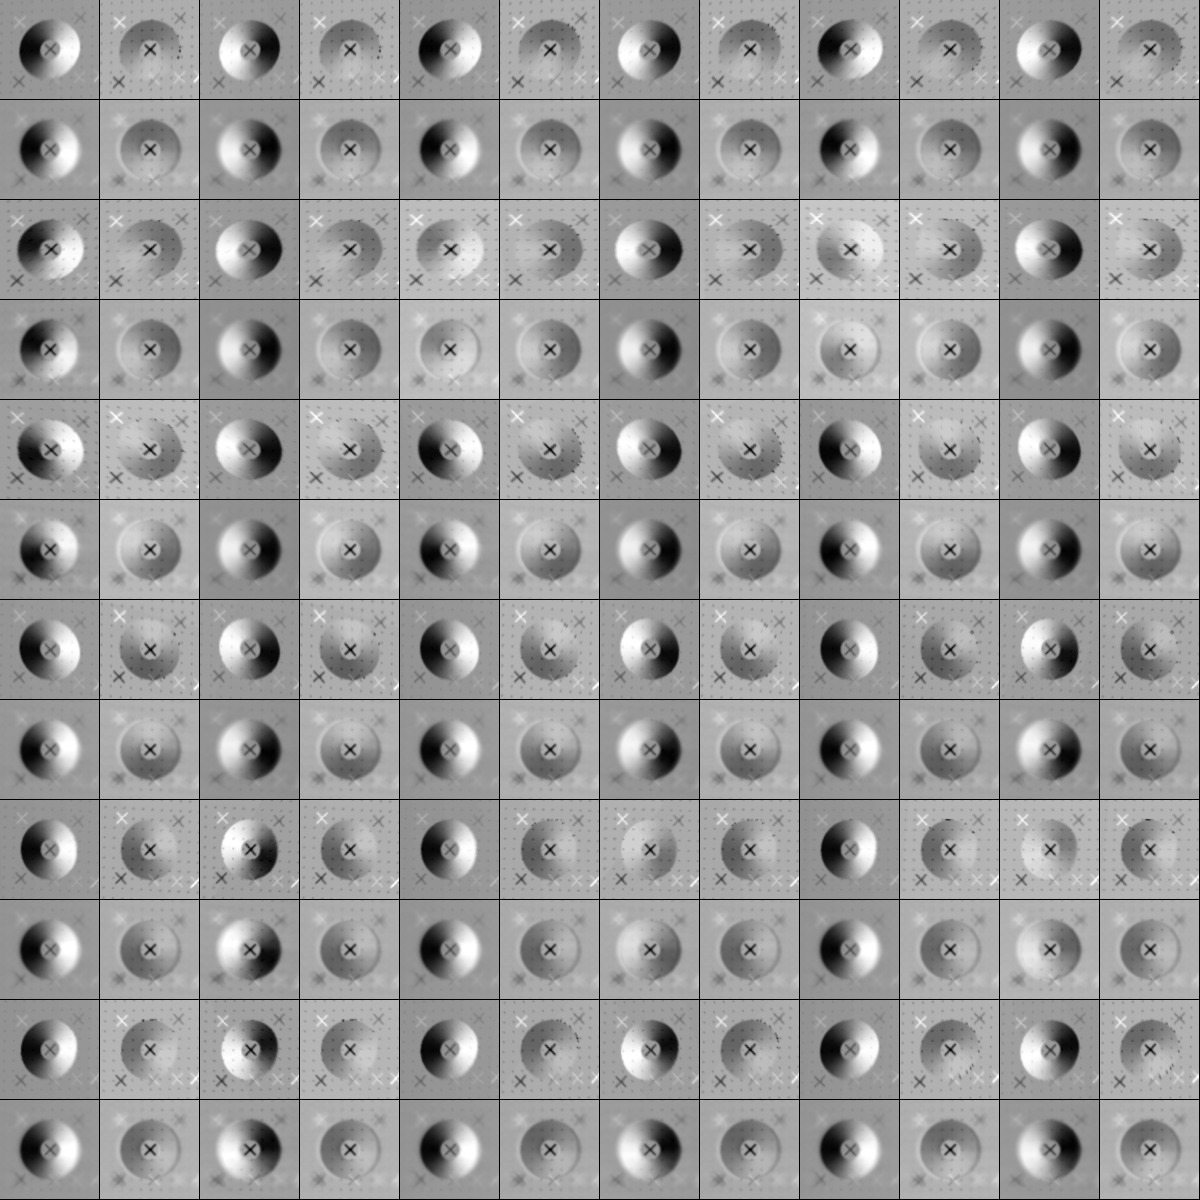
Landmark Display after 300 iterations:
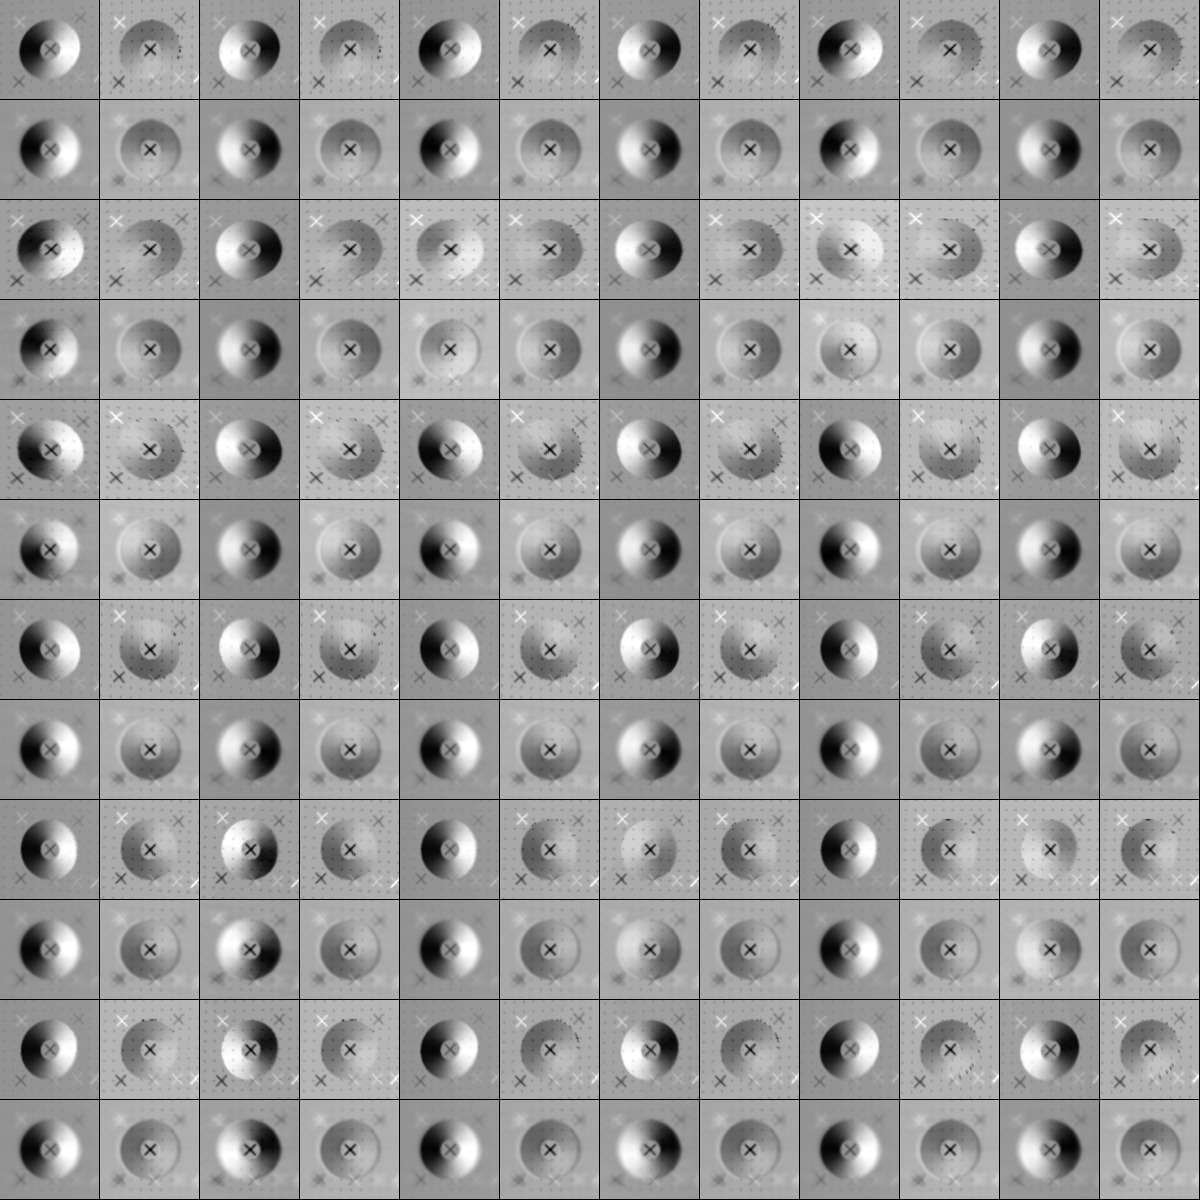
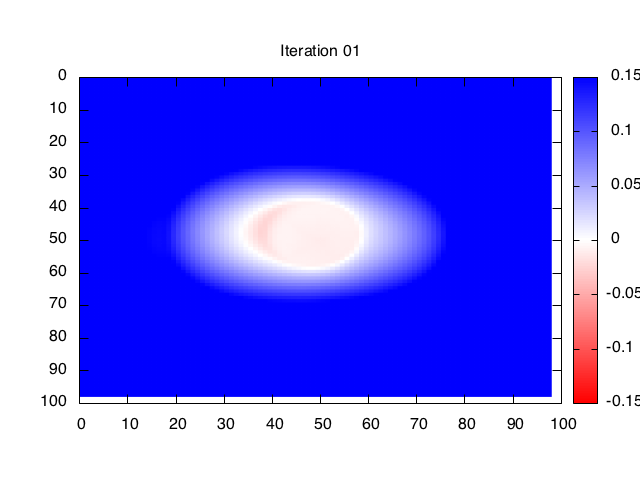
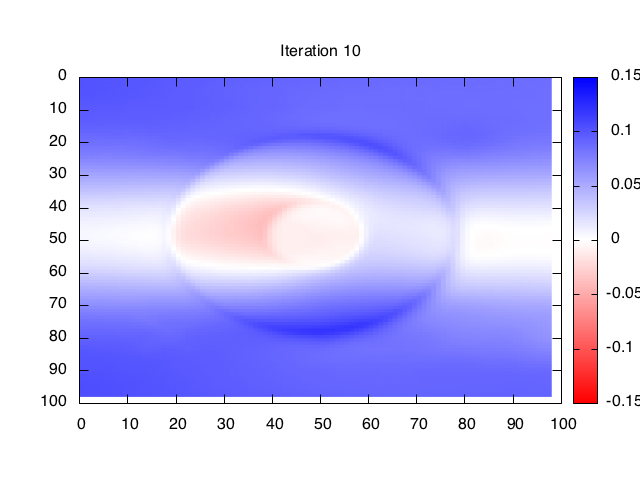
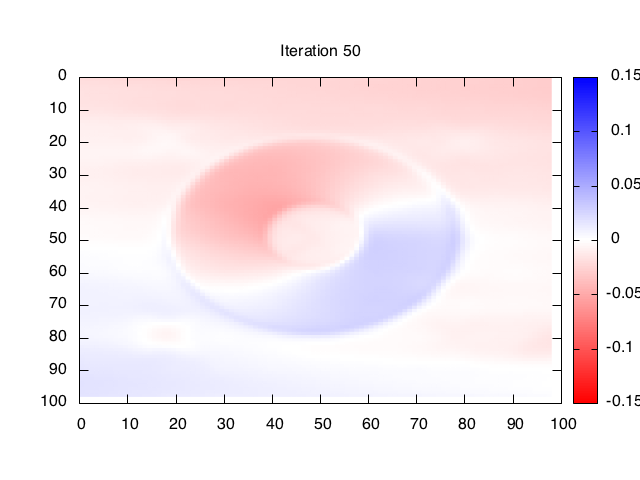
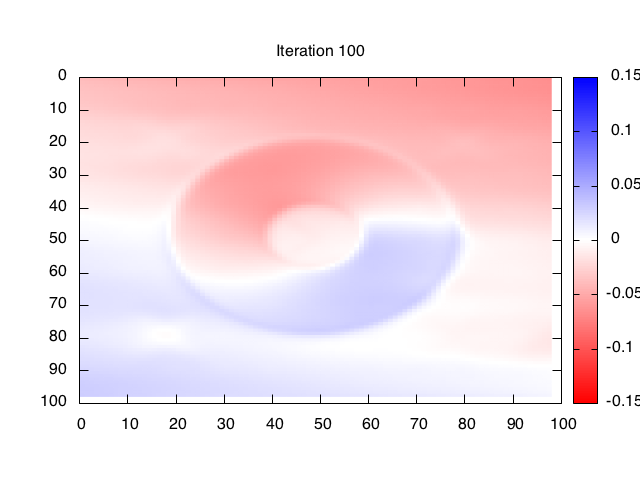
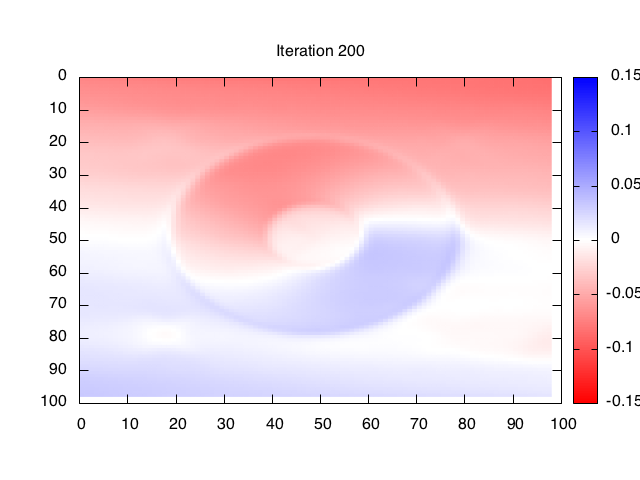
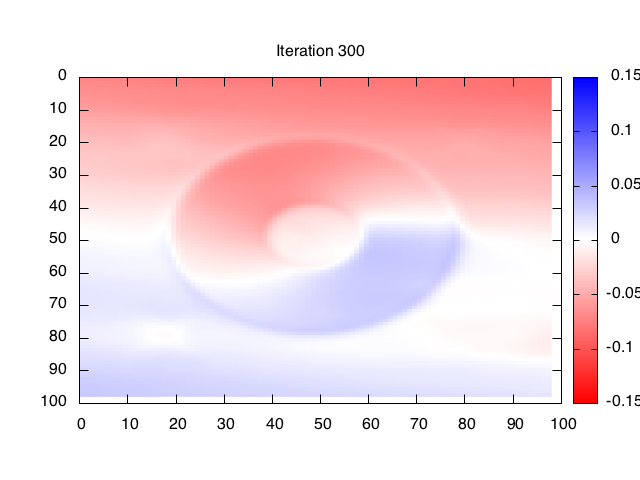
Heat Plots of CopmMapVec RMS
