|
Size: 4105
Comment:
|
Size: 5454
Comment:
|
| Deletions are marked like this. | Additions are marked like this. |
| Line 46: | Line 46: |
| * [[check.txt]] - List of landmarks and overlaps for landmarks whose residual standard deviation is greater than the user-specified limit. * [[EMPTY.TXT]] - [[lithos]] seed file for batch deletion of landmarks which are not contained in any pictures or limbs. * [[FLATLIST.TXT]] - List of flat maps (landmarks containing no topography). * [[LMKVECS.TXT]] - Landmark vectors for every landmark contained in [[LMRKLIST.TXT]]. * [[MAPCHK.TXT]] - List of maplets whose difference between predicted and observed pixel/line locations in attached images is greater than a user-specified limit, or who have two or fewer overlaps attached to them. * [[MAPRES.TXT]] - Maplet resolution information for maplets contained in at least one picture or limb. * [[New_Limbs.in]] - [[lithos]] seed file to attach map to limbs for every landmark contained in [[LMRKLIST.TXT]]. * [[PRUNE.TXT]] - List of landmarks for which the number of pictures in which they are contained exceeds the default limit of 500, or the user-specified limit, PRNLM, set within [[INIT_LITHOS.TXT]]. * [[RANGES_SOLVED.TXT]] - Date and range information for each picture listed in [[PICTLISTS.TXT]] or [[PICTLIST.TXT]]. * [[veto.txt]] - [[lithos]] seed file to detach from landmarks and limbs a map with a residual standard deviation greater than the user-specified limit. |
residuals
Compiled by KD
Description
The routine,residuals, tests the landmarks to look for problems and gives reports based on landmarks, pictures, and maps. In other words, residuals shows how well SPC performed. How residuals does this is in the basic procedure below.
- Compares predicted and observed pixel, line position of the landmarks in the images
- Produces RSS of the diagonal convariance elements of each control point
- Describes landmark position uncertainty
- Flags landmarks with residuals over specified pixel value
A description of the control points is given below.
- Inputs are weights for S/C uncertainties from measurement uncertainties and from a-prior shape constraints
Control points solution results in a 3x3 output covariance for each control point. Diagonal elements are uncertainties along maplet coord. system axes, i.e. two horizontal directions & height. Typically SPC produces comparable horizontal & height uncertainties. Results are summarized as a scalar standard deviation per degree of freedom in meters
- Residuals check automatically flags errors beyond certain input values in dump file for ease of inspection
Input - files
Input - stdin
- enter plim (px,km,km)
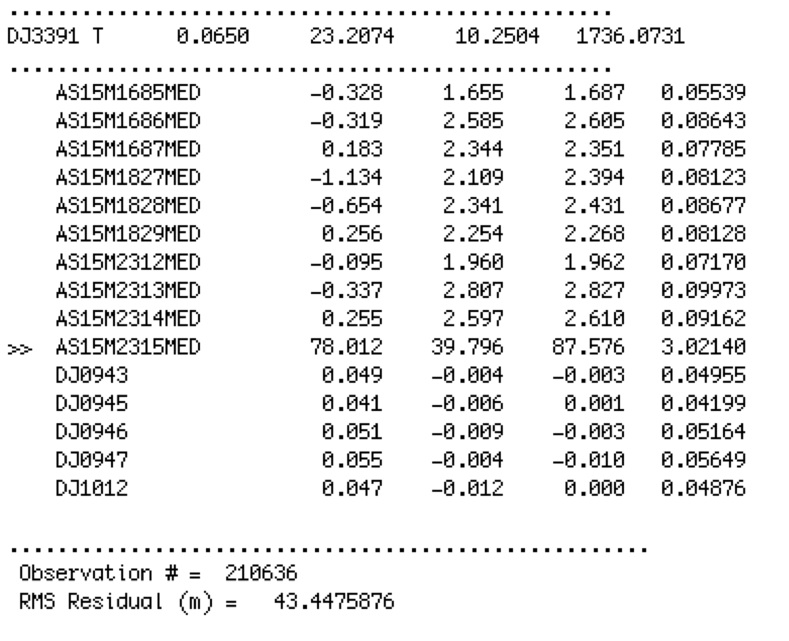
The number of pixels an image needs to be "off" (in maplet resolution?) to throw the chevron (>>) flag (in RESIDUALS.TXT)
- The standard deviation (that is allowed? ask EEP) of the center of each landmark (calculated by taking the vectors from the spacecraft to the center of a landmark; one vector per image in the landmark)
- Sets the "bin" size for the final histogram (basically how many images are in which categories). This histogram is found at the bottom of PICINFO.TXT.
2.5, 1, 001
Output
check.txt - List of landmarks and overlaps for landmarks whose residual standard deviation is greater than the user-specified limit.
EMPTY.TXT - lithos seed file for batch deletion of landmarks which are not contained in any pictures or limbs.
FLATLIST.TXT - List of flat maps (landmarks containing no topography).
LMKVECS.TXT - Landmark vectors for every landmark contained in LMRKLIST.TXT.
MAPCHK.TXT - List of maplets whose difference between predicted and observed pixel/line locations in attached images is greater than a user-specified limit, or who have two or fewer overlaps attached to them.
MAPRES.TXT - Maplet resolution information for maplets contained in at least one picture or limb.
New_Limbs.in - lithos seed file to attach map to limbs for every landmark contained in LMRKLIST.TXT.
PRUNE.TXT - List of landmarks for which the number of pictures in which they are contained exceeds the default limit of 500, or the user-specified limit, PRNLM, set within INIT_LITHOS.TXT.
RANGES_SOLVED.TXT - Date and range information for each picture listed in PICTLISTS.TXT or PICTLIST.TXT.
veto.txt - lithos seed file to detach from landmarks and limbs a map with a residual standard deviation greater than the user-specified limit.
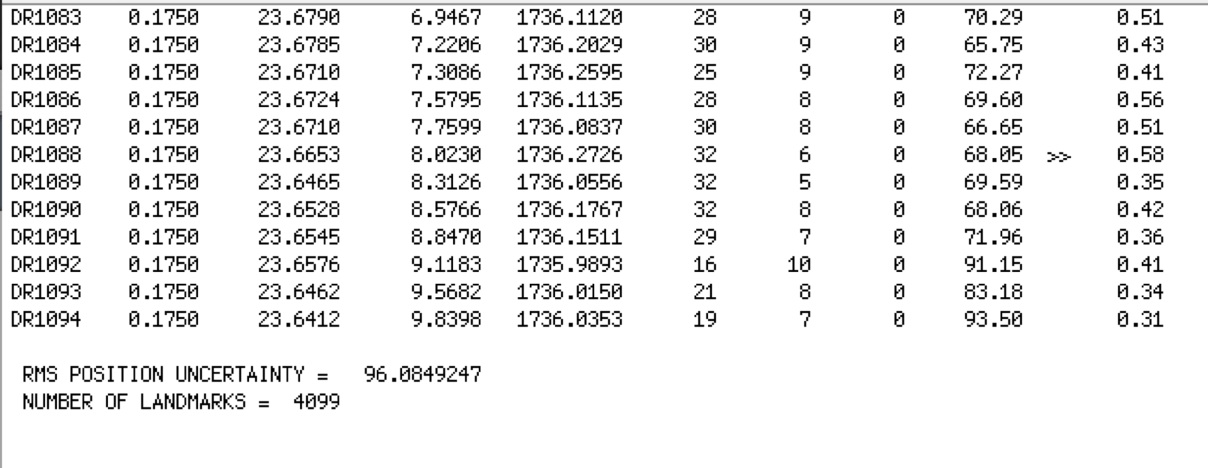
Example of MAPINFO.TXT

Example of a single landmark in RESIDUALS.TXT

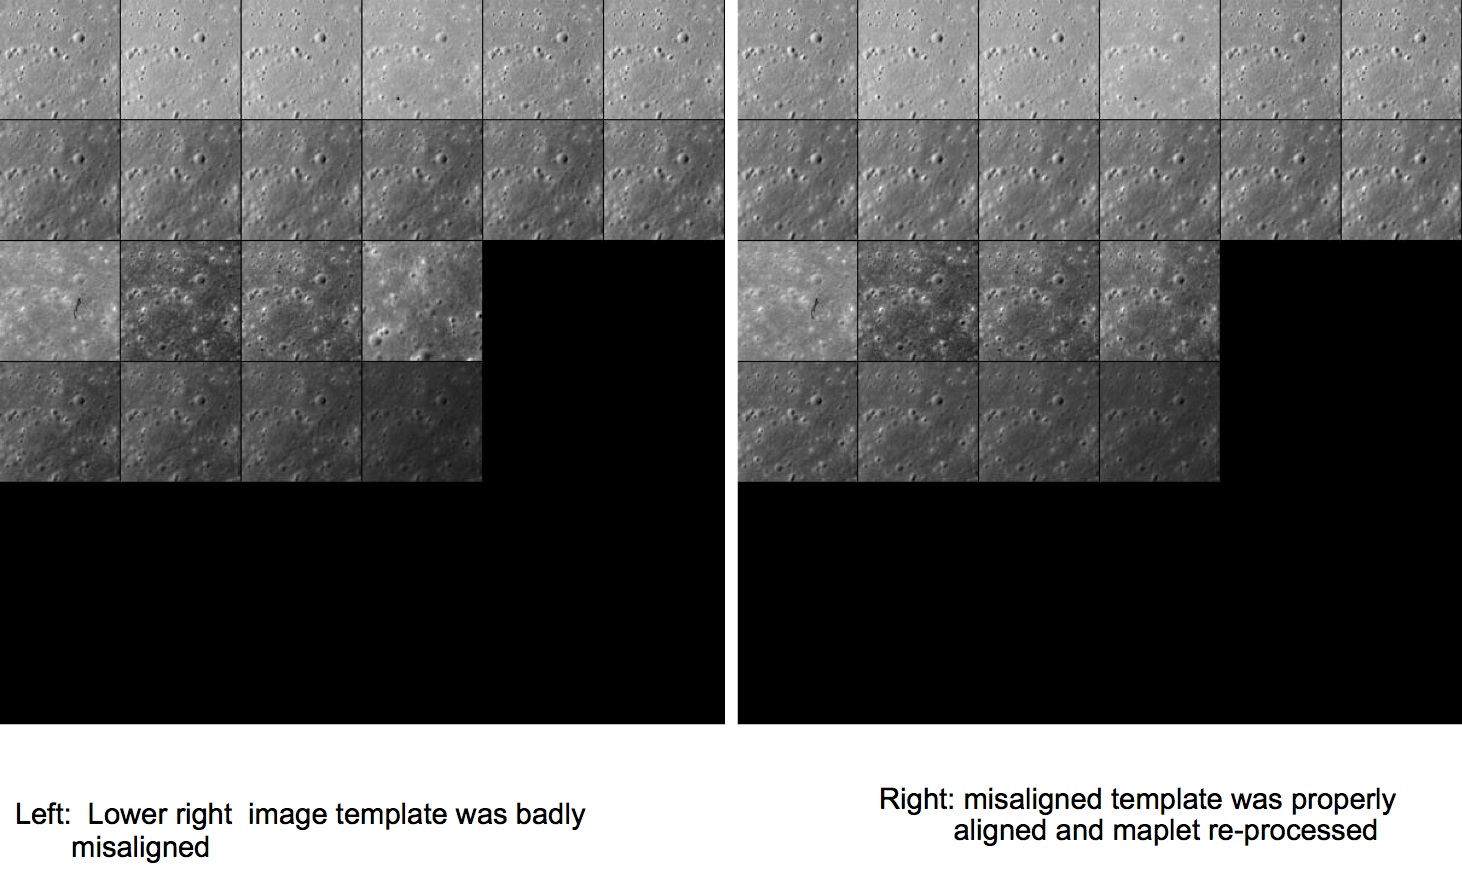
What a Bad & Fixed Image Looks Like

Qualitative Checks
The routine residuals is not the only way to check how well SPC performed. One can simply observe the maplets generated. The information below is what to look for when visually inspecting a maplet to judge its quality.
- Qualitative checks are important to verify that the quantitative error estimates are believable
Render a single maplet, or a DEM synthesized by a collection of maplets, at the same geometry & illumination conditions as the images themselves
- Do all the features in the images appear in the DEM ?
- Are the smallest discernible features in the images, e.g., boulders, craters etc. visible in the DEM as well ?
- Is the relative albedo solution such that the relative brightness of adjacent image features matches that of the DEM ?
- Are the heights solution such that the length and overall appearance of the shadows in the DEM matches that of the image ?
How are Uncertainties Introduced in the Data
- Main types of uncertainties:
- S/C trajectory, camera pointing, image timestamp
- Manifest themselves mostly in the projection of image template onto the surface. Corrected by global geometry solution
- Image noise, artifacts, smear, overall image quality
- Manifest themselves in predicted image template brightness and in its fit to the extracted image brightness
- Photometric model and reflectance function models
Show up in slopes & heights integration
Poor choice of a-priori parameters & data weights
- Evident at end of each estimation step; data won’t fit well
- S/C trajectory, camera pointing, image timestamp
- Often above contributions are correlated; individual contributors may not be separated until many processing steps have been taken
